Here's what customer experience looks like when it slips in a B2B SaaS company. Your CSAT sits at 91% and your NPS looks healthy, yet a 60-seat account doesn't renew. On the exit call, the admin says: "Every integration issue took two weeks and three people."
None of those tickets looked bad on its own. Each got a polite reply, a good rating and, eventually, a fix. The experience was the sum of them, and nobody owned the sum.
Where Pluno fits: Pluno is the AI agent for complex support. It's built for B2B support teams whose hardest tickets are technical and account-specific, and who already run a help desk and an engineering stack. It works inside your existing help desk and helps at onboarding, during everyday product use and when something breaks. You get complete first answers with sources, technical issues investigated before they reach engineering, and escalations that keep the ticket up to date.
This guide is for the support leader who has been asked to "own CX" or to explain why customers leave. It covers the definition, the evidence, the B2B SaaS customer journey, and how to measure and improve customer experience from the place you already run: the support queue. When I compare CX metrics, I judge each one on the same four yardsticks: the question it answers, when you collect it, who usually owns it and what it misses.
TL;DR
- Customer experience meaning: CX is how customers perceive every interaction with your company across the customer journey, from evaluation to renewal. Customer service and support are parts of it, not the whole.
- Why it matters: in a Qualtrics XM Institute study of 20,001 consumers (vendor research), 34% cut spending after a negative experience, and fewer than 1 in 3 give companies feedback. Much of the damage never reaches a survey.
- The state of CX: Forrester's US CX Index fell for four years to an all-time low in 2025. In 2026, 26% of US and Canadian brands improved significantly and 7% declined.
- How to measure it: pair NPS for the relationship, CSAT or Customer Effort Score for interactions, and behavior metrics (repeat contacts, resolution time, gross and net revenue retention). Add product adoption and cancellation reasons for customers who never write in.
- Where support fits: support shapes onboarding, everyday use and issue resolution, and feeds evidence into renewal and product decisions. Tickets tagged by journey stage, contact reason and cause are some of the most useful CX data you have.
- Bottom-line advice: rank friction points by severity, the accounts they affect and the effort to fix them. Fix the top three at the source with one owner and a date, and tell customers when it's done. The calculator sizes the revenue involved.
Sources: research firms, consultancies and vendor reports are linked where they're cited, and vendor research is labeled as such. Calculations, journeys and example tickets are illustrative unless a source is given. I checked every figure on November 11, 2026.
Disclosure: I work at Pluno. We make an AI agent for complex support that runs inside the help desk and resolves, drafts and escalates tickets.
What is customer experience (CX), and what does it mean for your support team?
Customer experience is the customer's perception of every interaction with your company, added up over the whole relationship. It includes the product, but also the sales call, the invoice, the outage email and the support ticket.
The research firms that study CX agree on the core. Gartner describes it as the customer's perceptions and feelings caused by the one-off and cumulative effect of interactions with a supplier's employees, systems, channels or products. Forrester's long-standing definition is shorter: "how customers perceive their interactions with your company."
Two words in those definitions do most of the work. Perception means the customer decides, not your dashboard. Cumulative means a bad month can outweigh a year of well-rated tickets.
For a support team, that definition has three practical consequences:
- You own a slice, not the whole. Support shapes onboarding, everyday use and issue resolution, but customers judge you on every stage. A perfect reply can't make up for a product that keeps breaking.
- You hear about every stage. Customers write in about pricing, invoices, setup, bugs and renewals, so your tickets show every stage from the customer's side. They only cover customers who write in, though, not the ones who struggle in silence.
- Perception beats process. A ticket solved within your SLA can still feel slow if the customer had to chase it three times.
What does CX mean in job titles and team names?
CX (customer experience) shows up in job titles (Head of CX, CX operations manager), team names and software categories such as CX platforms.
Some companies rename their support team "CX". That's fine as a label, but it can blur two different jobs: running support well and owning the experience across the company. I separate them further down.
The three parts of every experience: did it work, was it easy, how did it feel?
Forrester's CX Index evaluates the effectiveness, ease and emotional quality of customers' interactions with a brand. Qualtrics XM Institute uses a similar trio, success, effort and emotion. The labels differ, but the questions are the same: did it work, was it easy, and how did it feel?
Here's how the three parts look from the support queue:
- Effectiveness: did the customer get what they came for? In support, that means the problem was solved, completely, without a second ticket.
- Ease: how much work did it take? Repeating details, switching channels, waiting for a callback and chasing updates all add effort.
- Emotion: how did it feel? A customer can get the right answer and still feel ignored if nobody explained what was happening.
Customer experience in B2B SaaS: what changes
Most CX advice is written for consumer brands. B2B SaaS changes four things:
- An account is many people. The buyer who signed, the admin who set it up and 40 end users each have their own experience. The person who rates your ticket is rarely the person who signs the renewal.
- The relationship is long and contractual. Customers judge you over a 12- or 24-month term, so a slow pattern hurts more than one bad day.
- Problems are technical. Many tickets need logs, configuration or code to solve, so the experience depends on how well support and engineering work together.
- Renewal is the verdict. A bad consumer experience costs the next purchase. A bad B2B experience shows up months later, as churn or a smaller renewal.
Why customer experience matters: what the evidence shows
Customer experience matters because it decides whether customers stay, spend more and recommend you. The evidence for that link is consistent across sources, though most of it comes from consumer surveys and vendor research, so read each number with its limits.
CX quality is recovering from a four-year slide
Forrester's US CX Index fell for a fourth straight year in 2025, to an all-time low: 25% of US brands declined and 7% improved. In 2026 the trend turned. Forrester's 2026 study covered more than 224,000 customers rating 462 brands across 13 countries. In the US and Canada, 26% of brands made statistically significant gains and 7% declined.
The recovery is partial. Forrester notes that US scores remain slightly below their 2024 levels, and emotion was the dimension that improved most.
Bad experiences cost revenue, quietly
In a Qualtrics XM Institute study of 20,001 consumers in 14 countries (vendor research), 34% of consumers reduced spending with a company after a negative experience, and 13% stopped spending entirely. Fewer than 1 in 3 consumers give companies feedback, the lowest share the study has recorded.
That second number is the one support leaders should remember. Qualtrics notes that these spending cuts often happen silently, so your surveys hear from only some of the customers a bad experience affects.
An older PwC survey points the same way. In its 2018 report, 32% of customers said they would stop doing business with a brand they loved after one bad experience, and 73% called experience an important factor in buying decisions, behind price and product quality.
Service prevents disloyalty more than it creates loyalty
Gartner's customer service research found that service interactions are far more likely to lead to disloyalty than loyalty. A great support interaction rarely wins a customer over on its own, but a high-effort one can lose them.
The same research points to a second lever. When service also helped customers get more value from the product, for example by showing them a better way to use it, the probability that they'd stay rose to 82%.
CX leaders grow faster
A McKinsey study found that US CX leaders achieved more than double the revenue growth of CX laggards between 2016 and 2021. It's a correlation, not proof that CX caused the growth, but the direction is consistent with the other studies.
In SaaS, it shows up as retention
In a SaaS company, customer experience shows up in your own gross and net revenue retention, which the measurement section below covers, and in the cancellation reasons behind them. Those numbers are more useful to you than any borrowed benchmark.
Customer experience vs customer service, support, UX and customer success
Customer experience is the whole. Customer service, customer support, user experience (UX) and customer success are parts of it, each with its own owner and its own measure of success.
How CX relates to service, support, UX and customer success in a SaaS company
| Scope | Usually owned by | Typical measure | SaaS example | |
|---|---|---|---|---|
| Customer experience (CX) | Every touchpoint across the journey | The whole company, often coordinated by a CX or operations lead | NPS, retention, churn | A renewal invoice arrives with a price nobody mentioned |
| Customer service | Every time the company helps a customer | Sales, onboarding, support and success | CSAT, Customer Effort Score | A new admin asks how to set up user roles |
| Customer support | Fixing a specific problem | The support team | Time to resolution, first contact resolution | A webhook stops firing after an update |
| User experience (UX) | Using the product itself | Product and design | Task success, product analytics | The export option is buried three menus deep |
| Customer success | Helping accounts reach their goals and renew | Customer success managers | Product adoption, revenue retention | A quarterly review shows the team uses one feature out of ten |
Owners vary by company, and small teams often combine several rows.
A practical test: if it's about one interaction, it's service or support. If it's about using the product, it's UX. If it's about the whole relationship, including moments with no conversation at all, it's customer experience.
CX vs CRM: a CRM (customer relationship management system) is software for managing account data and history, such as Salesforce or HubSpot. CX is what the customer perceives. A CRM can help every team see the same account history, but owning one doesn't create a good experience. My guide to what customer service is covers the service, support and care distinctions in more depth.
The B2B SaaS customer journey: where customer experience is won or lost
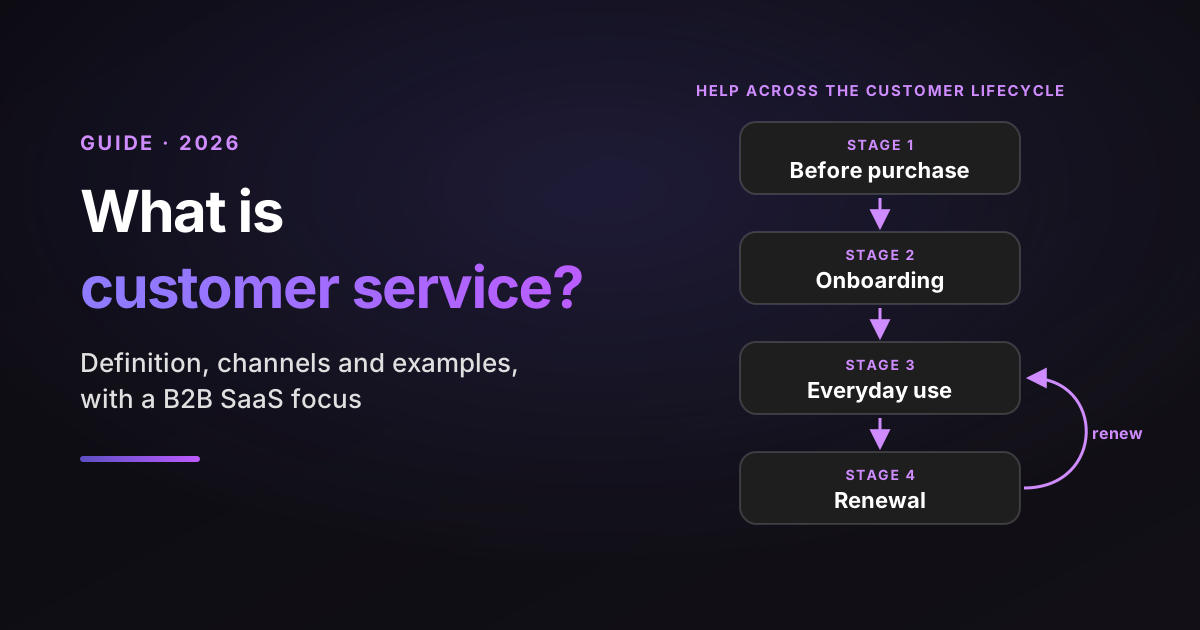
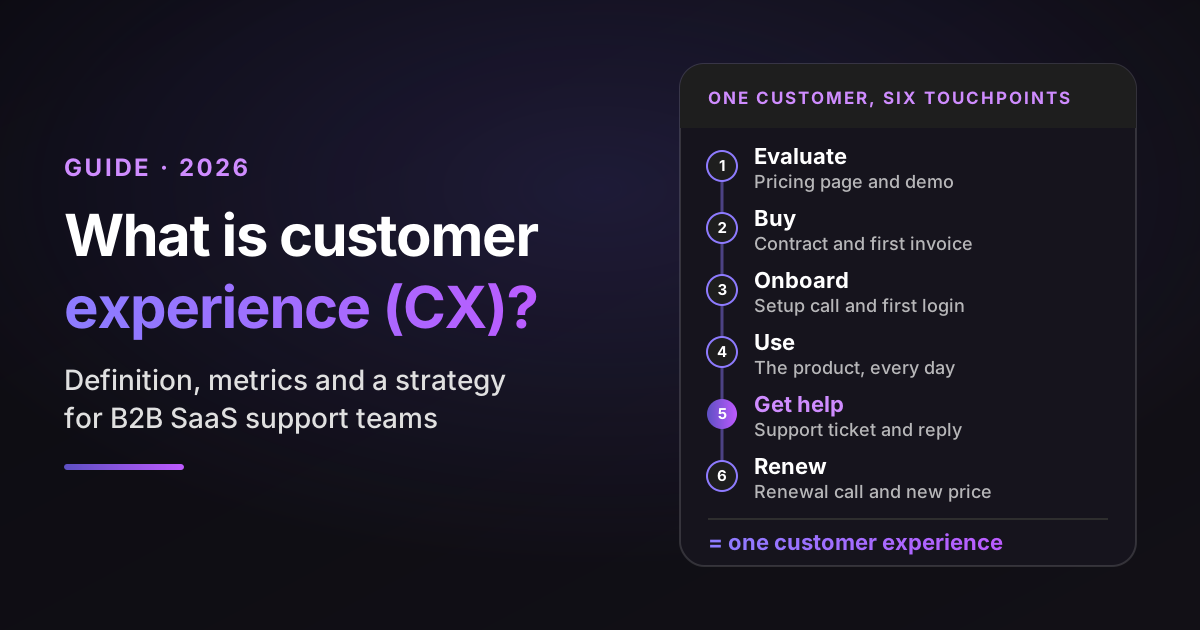
A B2B SaaS customer moves through six stages: evaluate, buy, onboard, use, get help, and renew and expand. Each stage has its own touchpoints and owner, and the experience usually breaks at the handoffs between them.
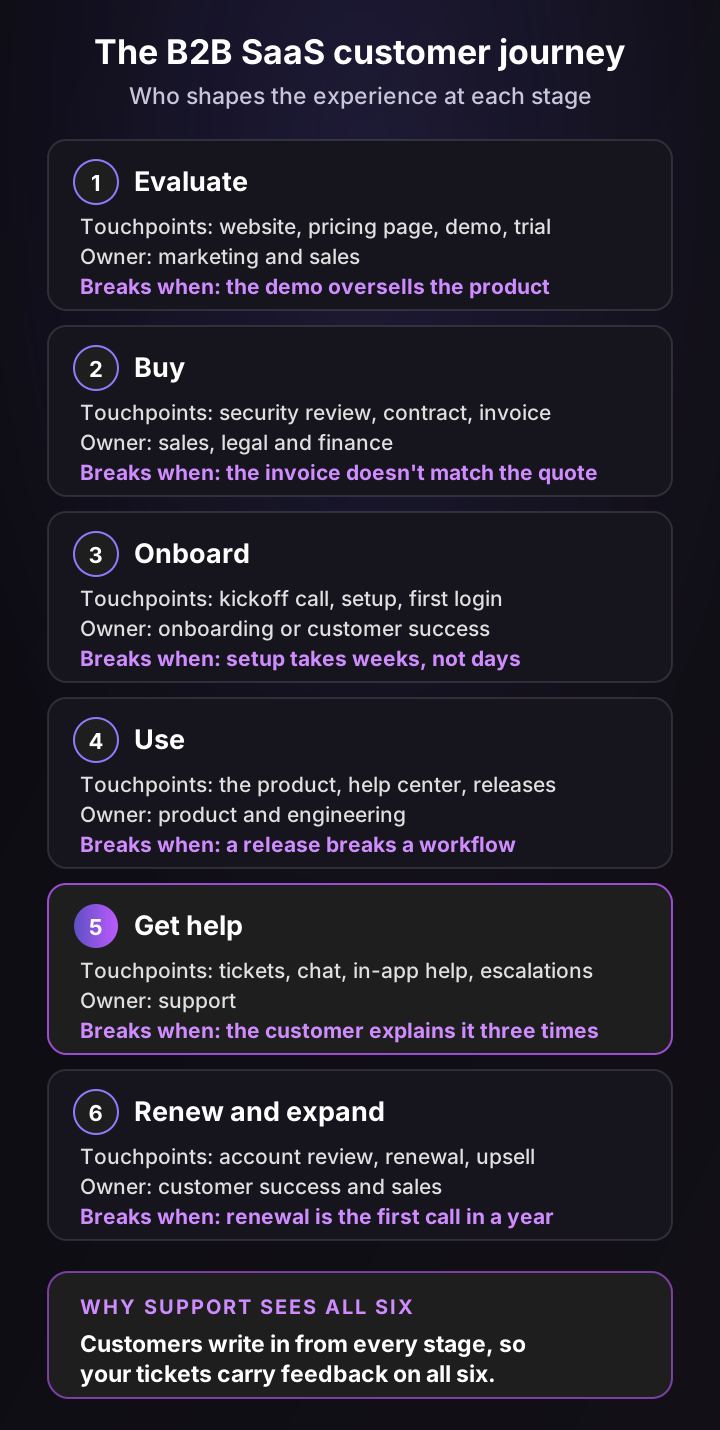
Support is the stage that hears about all the others. Here's the kind of ticket each stage tends to produce, and what it tells you:
Tickets from each journey stage and what they tell you
| Journey stage | A ticket you might see | What it tells you |
|---|---|---|
| Evaluate | "The demo showed SSO on this plan, but I can't find it." | Sales promised more than the plan delivers |
| Buy | "Why does our invoice have 12 extra seats?" | Billing and contract terms aren't clear |
| Onboard | "We've been trying to connect our CRM for a week." | Setup is too hard, or the docs skip a step |
| Use | "Reports stopped loading after Tuesday's release." | A regression, and probably many silent users affected |
| Get help | "This is the third time I'm explaining this." | Context gets lost in handoffs |
| Renew and expand | "Before we renew, can someone explain the new pricing?" | The account hasn't heard from you since it signed |
Tag each ticket with the stage it came from and you get a map of the experience, for every customer who writes in, that no survey gives you. I show how in step 3 of the strategy. A full customer journey map goes further and adds the customer's goals and feelings at each stage.
What makes a good customer experience? 6 principles
A good customer experience solves the customer's problem, takes little effort and leaves them feeling respected, at every touchpoint and not only the ones you survey. Six principles cover most of it, and each one has a check you can run this week.
1. It works the first time. The cheapest experience to deliver is the one that doesn't need a second ticket. In support, that means complete first answers: the fix, the reason and what to do if it happens again. Check: your repeat contact rate by contact reason.
2. It takes little effort. Friction adds up fast: repeating account details, being transferred, or re-explaining the issue to engineering. Gartner found that customers whose issue was resolved with low effort were much more likely to stay than customers who went through a high-effort experience. Check: Customer Effort Score after support cases, and transfers per ticket.
3. It's consistent across teams. The sales deck, the help center, the macro and the agent's reply should all say the same thing about a feature. Inconsistency reads as a broken promise. Check: pick your top three features and compare what each team's material says about them.
4. It's proactive. Customers who hear about an outage, a known bug or a price change from you first are calmer than those who find out on their own. Proactive messages also prevent a wave of duplicate tickets. Check: in your last three incidents, did customers hear from you before they wrote in?
5. It remembers context. Asking for a screenshot of a setting you can see in your own admin panel tells the customer you didn't look. Every handoff should carry the account, the history and what's been tried. Check: sample 20 tickets and count how often an agent asked for information you already had.
6. It closes the loop. When a customer reports a bug or asks for a feature, the experience isn't over until they hear that it shipped. It costs one message and shows the report was worth making. Check: the share of bug tickets where the customer was told about the fix.
Customer experience examples: 4 moments from one account's year
These are illustrative moments from a mid-sized B2B SaaS account, not customer cases. Each shows the same situation handled two ways.
1. The stalled onboarding
- Poor: the admin gets a welcome email and a link to the docs. Two weeks later, the integration still isn't connected, and nobody notices until the renewal forecast.
- Better: a setup checklist tracks the integration step. When it stalls for three days, someone reaches out with the exact fix for that CRM.
- What made the difference: someone watched for silence, not only for tickets.
2. The outage
- Poor: customers find out from their own users, flood support with tickets and get a generic "we're looking into it" macro.
- Better: a status page update and an in-app banner go out within minutes, support links new tickets to one incident, and every affected customer gets the post-incident summary.
- What made the difference: the company spoke first, and spoke once.
3. The bug that needs engineering
- Poor: the ticket is escalated with one line, engineering asks for steps to reproduce, and the customer is asked for the same screenshots twice. Three weeks pass in silence.
- Better: the escalation arrives with the account, the error, the steps and what's been tried. The customer gets a workaround the same day and an update each time the issue changes status.
- What made the difference: a complete handoff and a feedback loop back to the customer.
4. The renewal
- Poor: the first conversation in a year is the renewal call, and it opens with a price increase.
- Better: a short review two months earlier covers what the account achieved, the open tickets and what's coming. The price change is explained before the quote.
- What made the difference: the renewal confirmed what the customer already knew, instead of surprising them.
How to measure customer experience: 7 CX metrics compared
No single number measures customer experience. Pair a relationship survey (NPS), interaction surveys (CSAT, Customer Effort Score) and behavior metrics (repeat contacts, resolution time and revenue retention), because surveys only hear from the customers who answer.
Here are the seven metrics I'd use, judged on the four yardsticks from the introduction:
7 CX metrics compared on the question each answers, when you collect it, who owns it and what it misses
| Metric | The question it answers | When you collect it | Usually owned by | What it misses |
|---|---|---|---|---|
| Net Promoter Score (NPS) | How likely is this customer to recommend us? | Every 6 to 12 months, per contact | CX, product or customer success | Which touchpoint drove the score |
| CSAT | Was the customer satisfied with this interaction? | Right after a ticket or chat is solved | Support | Customers who don't answer, and problems that come back |
| Customer Effort Score (CES) | How easy was it to get this done? | After a support case or a key task, such as setup | Support or product | How the customer felt about the outcome |
| Repeat contact rate | Did the problem stay solved? | Continuously, from help desk data | Support | Customers who gave up instead of writing back |
| Time to resolution | How long did the customer wait for a fix? | Continuously, from help desk data | Support | Whether the fix was right, and the effort in between |
| Gross revenue retention (GRR) | How much recurring revenue did we keep, before expansion? | Monthly or quarterly | Finance and customer success | Why accounts left, unless you record reasons |
| Net revenue retention (NRR) | Did existing accounts grow, after churn and downgrades? | Monthly or quarterly | Finance and customer success | Churn hidden behind a few large expansions |
How to calculate each CX metric
Write down how you calculate each metric before you report it. Otherwise this quarter's number and last quarter's won't be comparable.
How to calculate the 7 CX metrics, and the rule to fix before you report each one
| Metric | How to calculate it | Fix this rule before you report |
|---|---|---|
| NPS | % of promoters (9 or 10) minus % of detractors (0 to 6), on a 0 to 10 "how likely are you to recommend us?" scale | Who gets the survey, and whether accounts or contacts are weighted equally |
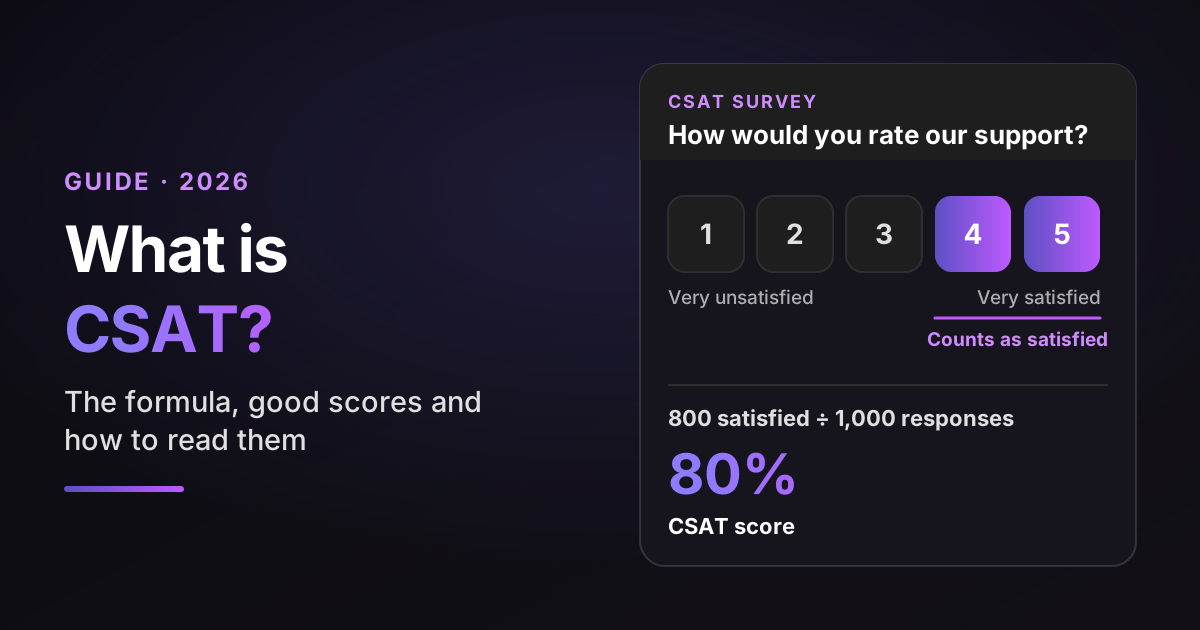
| CSAT | Satisfied responses (4 or 5 on a 5-point scale) ÷ all responses × 100 | The scale and the response count, reported next to the score |
| CES | Average answer to "How easy was it to get your issue resolved?" on a 1 to 7 scale | Which cases trigger the survey: every solved ticket, or only some |
| Repeat contact rate | Solved tickets followed by another ticket from the same account about the same issue ÷ all solved tickets | "Same issue" (same contact reason tag, or a linked ticket) and the window, such as 7 days |
| Time to resolution | Median time from ticket creation to final solve | Business or calendar hours, and reopened tickets counted to their final solve |
| GRR | (Starting ARR − churn − downgrades) ÷ starting ARR | A fixed cohort: only accounts you had at the start of the period, with no expansion counted |
| NRR | (Starting ARR − churn − downgrades + expansion) ÷ starting ARR | The same fixed cohort as GRR, so new customers don't inflate it |
A few notes on the less obvious ones:
- NPS comes from Bain's Net Promoter System. Fred Reichheld introduced it in Harvard Business Review in 2003.
- GRR excludes upsells, cross-sells and price increases, so it can't exceed 100%.
- NRR includes expansion. In its 2025 retention benchmarks, SaaS Capital reported a median NRR of 102% for private B2B SaaS companies with $25,000 to $50,000 in annual contract value.
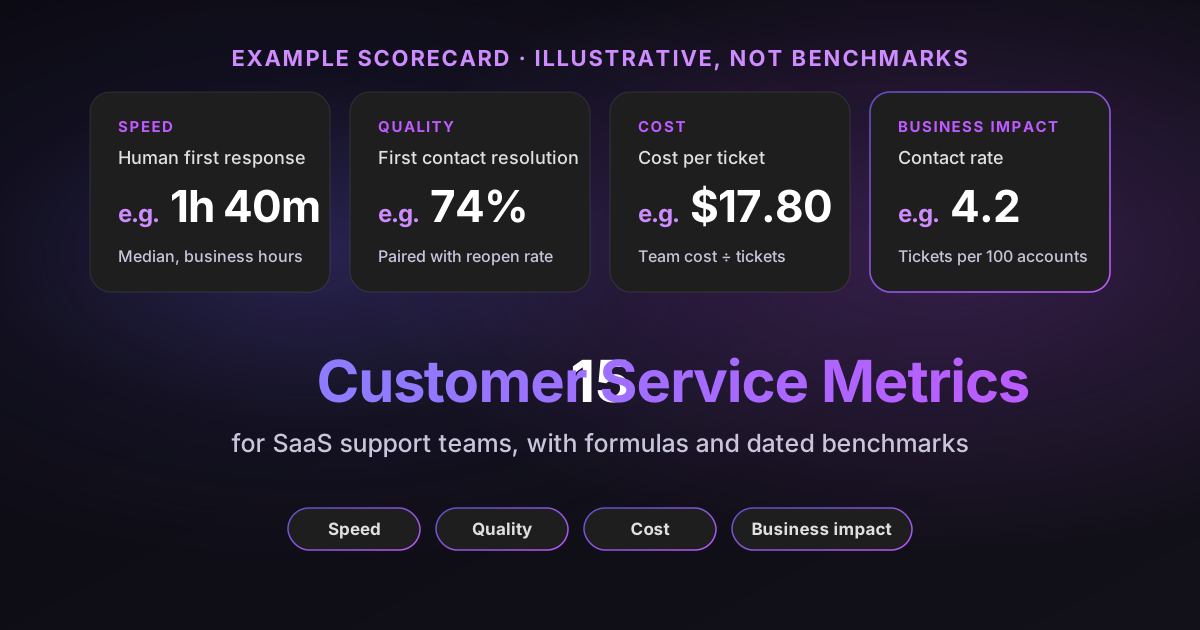
GRR is the cleaner CX signal of the two, because NRR can rise while unhappy accounts quietly leave. My guides to the CSAT score and to customer service metrics cover the support-side formulas in detail.
Read NPS by account, not only by contact
In B2B, one account sends you many survey answers, and they don't all come from the person who decides the renewal. Before you read the score:
- Choose the roles you survey: usually the buyer, the admin and a sample of end users.
- Show response counts by role, so you can see whether the score is mostly end users.
- Report an account-level score that weights each account once, next to the contact-level score. Otherwise an account with 30 respondents outweighs ten accounts with two each.
Build a CX scorecard from surveys and behavior
Pick one metric from each group, then segment every number by account size, plan and journey stage:
- Relationship: NPS, read per account rather than as one company-wide number.
- Interaction: CSAT or CES on support cases. If you can only run one, CES tends to say more about process problems.
- Behavior: repeat contact rate and time to resolution from your help desk. They cover every customer who contacts support, including the ones who never answer a survey.
- Adoption: product usage and onboarding completion from your product analytics. They cover the customers who never write in, including those who give up on a task.
- Outcome: GRR and NRR, reported next to the other four so the link to revenue stays visible, with the cancellation reasons behind them.
Report them together, monthly. A falling CSAT with steady GRR is a warning.
A steady CSAT alongside falling GRR warrants investigation across support, product, onboarding and commercial factors. Compare cancellation reasons, repeat contacts and feedback from buyers and admins, since the person who rates a ticket is rarely the one who decides the renewal.
Use ticket text as voice of the customer data
Voice of the customer (VoC) is everything customers tell you, in their own words: surveys, tickets, chat transcripts, call recordings, reviews and renewal calls. Most VoC programs start with surveys, but surveys reach a sample and ask your questions.
Tickets are different. Customers write them unprompted, about the problem that matters to them right now, and every account that asks for help shows up. Reading them by topic and journey stage tells you what to fix. The survey score tells you only how much it hurt.
Tickets have a blind spot, though: customers who struggle in silence or abandon a task without writing in. Fill it with product adoption data, onboarding completion, account interviews and cancellation reasons.
What poor customer experience costs: run your own numbers
Poor customer experience costs you churned revenue first, then a layer of costs that don't show up as churn: repeat tickets, engineering time, renewal discounts, smaller expansions and lost referrals.
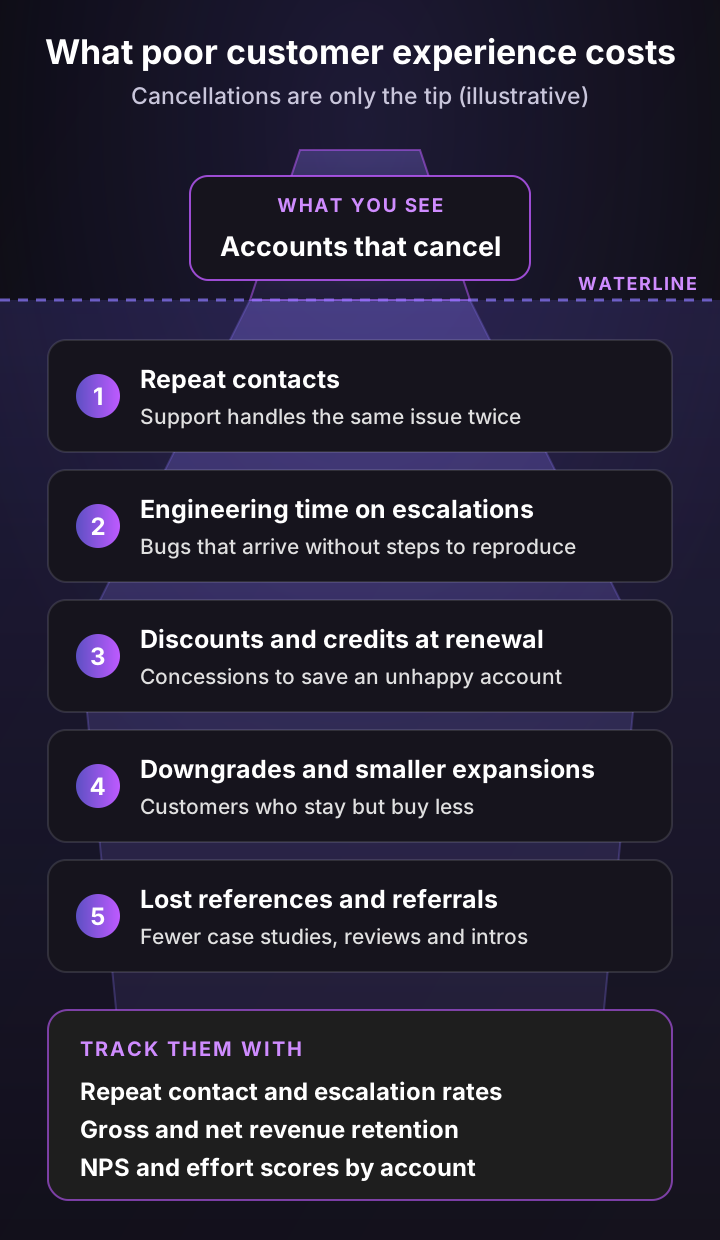
The calculator below sizes the visible part. Enter your accounts, the average revenue per account, your annual logo churn and the share of cancellations where the experience was a main reason. Take that share from cancellation reasons or exit interviews, not from a benchmark.
What poor customer experience costs you
Your own numbers, not benchmarks. Logo churn is the share of accounts that cancel in a year, and the model assumes churned accounts are average size. For the experience share, use your cancellation reasons or exit interviews: the churned accounts that named onboarding, support, reliability or product friction, not budget cuts, an acquisition or a shutdown. The three-year figure is year-one retained revenue × (1 + retention rate + retention rate²), where the retention rate is 1 minus your churn rate. It follows one cohort of saved accounts as they renew, doesn't add newly saved accounts each year and leaves out expansion revenue.
Revenue lost to churn a year
$540,000
36 accounts cancel
Lost to the experience
$216,000
14 accounts a year
Revenue kept in year one
$54,000
3.6 accounts saved
Preventing 25% of experience-related churn keeps about 3.6 accounts and $54,000 of revenue in year one, and about $143,338 over three years if those accounts then renew at your current rate. This estimates revenue retained under your assumptions. Evaluate investment against retained gross profit, support costs saved, implementation costs and uncertainty.
With the default inputs, 300 accounts paying $15,000 a year at 12% logo churn lose $540,000 of revenue a year. If 40% of those cancellations name the experience, $216,000 is experience-driven. Preventing a quarter of it keeps $54,000 in year one and about $143,000 over three years.
The three-year figure is year-one retained revenue × (1 + retention rate + retention rate²), where the retention rate is 1 minus your churn rate (88% here). It follows one cohort of saved accounts as they renew. It doesn't add newly saved accounts in years two and three, and it leaves out expansion revenue.
This estimates revenue retained under your assumptions. Evaluate investment against retained gross profit, support costs saved, implementation costs and uncertainty.
How to build a customer experience strategy in 7 steps
A customer experience strategy is a written plan for which experiences you'll improve, for which customers, in what order, and how you'll know it worked. Here's a version a support leader can start in one quarter, without a CX department.
Step 1: Write down the experience you promise
Write one sentence per customer segment, such as: "Admins at mid-sized accounts get set up in a week and never wait more than a day for an answer on a blocking issue." It turns a vague goal into something every team can test its work against.
Step 2: Map the journey and give every stage an owner
Use the six stages above. Name one owner per stage and one owner for each handoff between stages, because handoffs are where experiences break and where nobody feels responsible.
Step 3: Turn your tickets into voice of the customer data
When a ticket arrives, you know what the customer asked about, but often not why it happened. So keep the reason and the cause apart, with four fields on every ticket:
- Journey stage: where the customer was, such as onboarding, everyday use or renewal.
- Contact reason: what they asked about.
- Suspected cause: product bug, missing docs, process, billing, how-to or unknown, set when the ticket arrives.
- Confirmed cause: the same values, set by the agent after the investigation and before the ticket is solved.
AI tagging can fill the first three as tickets arrive, and the agent confirms or corrects the cause. After a month, report on confirmed causes, and watch the share still marked unknown.
Step 4: Baseline your CX metrics by segment
Record the scorecard from the measurement section, split by segment, before you change anything. Without a baseline, you can't tell an improvement from a quiet month.
Step 5: Rank friction points by risk, reach and effort
List the top 10 confirmed causes from step 3 and log each one in the friction log below. Record the unique affected accounts, their combined ARR, any evidence of renewal risk, the severity, the fix effort and an owner.
Count each account once per problem, and label affected ARR as exposure, not forecast loss: an account that hit a bug isn't necessarily about to leave. Pick the top three by risk, not the loudest three. Keep a fast path for severe incidents, such as data loss or a security issue, whatever the size of the accounts affected.
Step 6: Fix the cause, with one owner and a date
For each of the three, name the fix, its owner and a date. Some fixes sit in support (a better macro, a faster escalation path). Most sit in product, billing or onboarding, which is why the owner can't always be you.
While the fixes are underway, decide what agents may approve on their own. Which workarounds, account changes, credits and policy exceptions can they offer, up to what limit, and who decides the exceptions above it? Write it into your playbook, so customers get the same answer from every agent and nobody waits for a manager on a routine request.
Step 7: Review monthly and close the loop with customers
Run a 30-minute monthly review with the stage owners: the scorecard, progress on the three fixes and the next candidates. When a fix ships, tell the customers who reported the problem.
A worked example: the CX friction log
Here's the log for one friction point, from an illustrative 25-person support team at a B2B SaaS company. Copy the first two columns into a spreadsheet and add one row per problem.
CX friction log template, filled in for one illustrative friction point
| Field | What to record | Example |
|---|---|---|
| Journey stage | Where the customer was | Onboard |
| Contact reason | What customers asked about | "We can't connect our CRM" |
| Confirmed cause | What agents found after investigating | No connection test in setup, and the docs skip a step |
| Evidence | Ticket counts, quotes, renewal data | 18% of tickets come from onboarding, half of them about this integration |
| Affected accounts | Unique accounts, each counted once | 42 new accounts this quarter |
| Affected ARR (exposure) | Their combined ARR, not a loss forecast | $630,000 |
| Renewal risk | Signs the problem affects renewal | Accounts that raised it in their first 90 days renew at a lower rate |
| Severity | How badly it blocks the customer | High: it blocks first value |
| Fix effort | Rough size of the fix | Medium: one sprint, plus a guide |
| Owner | One named person | Product manager for onboarding |
| Action | The fix at the source | Connection test in the setup flow, a step-by-step guide and a day-3 check from onboarding |
| Deadline | A date, not a quarter | End of next month |
| Success metric | What should move, and where you'll read it | Onboarding tickets per new account, time to first value, 12-month GRR for the next cohort |
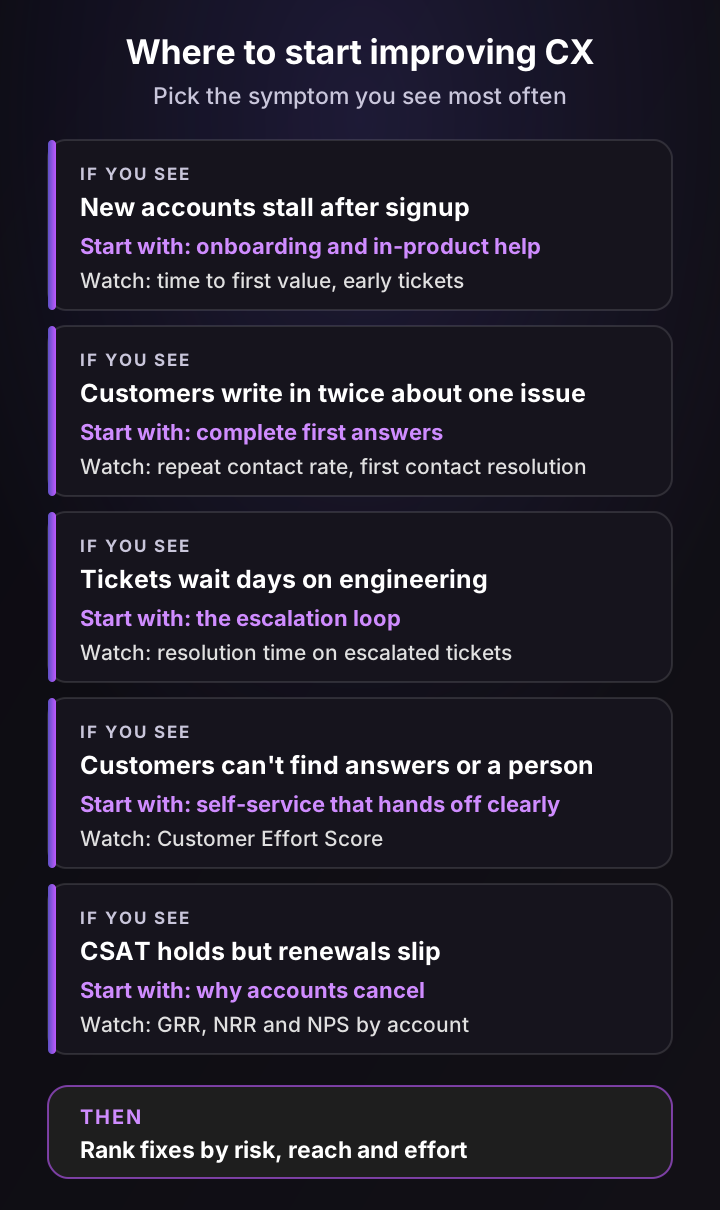
How to improve customer experience: 8 fixes that start in your support queue
To improve customer experience, start where you have the most control and the most data: the support queue. Every fix below improves the support interaction itself or sends what support learns to the team that can fix the cause.
1. Answer completely the first time
Give agents the context to solve the whole problem in one reply: past tickets with the same issue, the account's setup and the relevant docs. Then add "cause explained" and "prevention step" to your QA rubric, so complete answers get coached, not only fast ones. Watch: repeat contact rate and first contact resolution.
2. Stop making customers repeat themselves
Write a handoff note template with four lines: the account, the issue in one sentence, what's been tried and the next step. Use it for every transfer between agents, tiers and channels, so the next person can reply without asking again. Watch: transfers per ticket and Customer Effort Score.
3. Make escalations to engineering complete, and report back
Agree on an escalation template with engineering, using the fields from the bug example above, and a rule that every status change on the engineering issue posts back to the ticket. Then set a maximum gap between customer updates, such as two business days. Watch: time to resolution on escalated tickets.
4. Tell customers before they find out
The outage example above shows the pattern. To make it repeatable, prepare the status page message, the in-app banner and the post-incident summary as templates with named owners, and add a help desk rule that links new tickets about a live incident to one parent ticket. Watch: ticket volume during incidents, and how many customers wrote in before your first update.
5. Put help inside the product
Many questions start on a specific screen, such as a failed import or a confusing setting. Help that sits in the product, and can see the user's setup, answers them before they become tickets. Watch: tickets per active account and time to first value.
6. Keep a person within reach
Self-service and AI answers lower effort only if customers can still reach a person when they need one. Test it yourself: start in your help center and chat widget, and count the steps it takes to reach a human.
Then make the handoff a rule. When a customer asks for a person, hand the conversation over right away with the full transcript, and tell the customer when the team will reply, including outside staffed hours. In Pluno, a one-line Deflection AI workflow does this. Watch: Customer Effort Score and CSAT on AI-to-human handoffs.
7. Update your answers with every release
When a release changes a screen or a behavior, update the help center articles and macros that mention it in the same week. Brief support on what changed before customers notice, so the first ticket gets a current answer. Watch: ticket volume and repeat contacts in the week after each release.
8. Review quality on the tickets nobody rated
Start with your own survey data: what share of solved tickets got a rating last month? Everything outside that share is invisible to a survey-only view of quality. Review a sample of unrated tickets each week, or score them all with an automated QA rubric, and look for the same failures your low ratings show. Watch: QA scores on unrated tickets next to CSAT on rated ones.
Customer experience management: who owns CX, and which tools help
Customer experience management (CXM) is the ongoing practice of measuring the experience, finding what hurts it and fixing it across teams. It's the operating rhythm behind a CX strategy: the data, the reviews and the owners.
Who owns customer experience?
B2B SaaS companies tend to use one of three models:
- A dedicated CX team or executive owns the strategy, the surveys and the cross-team reviews. This is more common at larger companies.
- A CX council of stage owners (sales, onboarding, product, support, success) meets monthly and shares one scorecard. It suits mid-sized companies where each team has a lead but nobody owns CX full time.
- Support-led CX: the support or support operations team runs the measurement because it holds the most customer data. It works when leadership backs it, because most fixes sit in other teams.
Whichever model you pick, write down who owns each journey stage and each handoff. Shared ownership with no names attached is how the integration ticket in the introduction took two weeks.
The customer experience tool stack
Most B2B SaaS teams already own most of this stack. The help desk records the conversations. An AI layer works on them inside the same help desk: it answers, investigates, classifies and escalates them, using your CRM, product and engineering tools as sources and destinations.
The CX tool stack, by tool type, its role in CX and examples
| Tool type | What it does for CX | Examples |
|---|---|---|
| AI layer in the help desk | Answers, investigates, tags and escalates tickets inside the help desk you already use, and brings engineering updates back to the ticket | Pluno |
| Help desk | Holds every support conversation, your largest source of VoC data | Zendesk, Intercom, Freshdesk |
| Experience management and survey platform | Runs NPS, CSAT and journey surveys and analyzes the answers | Qualtrics, Medallia |
| Product analytics | Shows what users do in the product and where they drop off | Amplitude, Pendo |
| CRM | Holds accounts, contracts, renewals and revenue | Salesforce, HubSpot |
Pluno runs in Zendesk, Intercom, Salesforce Service Cloud, HubSpot, Jira Service Management and Freshdesk, so you add it to the help desk you have instead of replacing it. The integrations overview shows what it connects to, and the Zendesk and Intercom pages show what it adds in each.
For a support leader, the help desk is the most useful of these for CX. It knows which accounts struggle, with what and how often, at least among the ones who write in. Product analytics covers the ones who don't.
How AI is changing customer experience
AI can make the support part of CX faster and more consistent: answers around the clock, drafts with sources for agents and tickets tagged by topic as they arrive. It can also make the experience worse when it blocks the way to a person or answers without evidence.
Customers are wary. In a Gartner survey of 5,728 customers conducted in December 2023, 64% said they would prefer that companies didn't use AI in customer service. Their top concern was that it would get harder to reach a person.
Two years later, attitudes look more mixed. In a Gartner survey of 3,566 B2B and B2C customers in February and March 2026, 50% said their interactions were easier when companies used generative AI. Yet 87% said it was essential to offer a way to reach a human agent.
Three rules keep AI on the right side of that line:
- Answer only with evidence. The AI should reply when its sources support a complete answer, ask for a missing detail when it needs one and hand over otherwise.
- Keep the handoff visible and complete. The customer can always reach a person, and the person gets the full conversation and what the AI found.
- Measure AI separately. Report CSAT, repeat contacts and reopen rates for AI-resolved tickets, human-resolved tickets and handoffs as three cohorts.
My guide to AI for customer service ranks nine use cases by risk and shows how to roll them out.
What support teams say about customer experience
These are selected comments posted on Hacker News by people who have worked in support, built a product or been the customer, plus two Pluno customers on escalations. They're anecdotes, not representative research.
“I once reported a bug in their online keyboard configurator. About an hour later I got an email from one of their developers... Another hour went by and I got an email saying that he had found the bug and pushed a fix.”
“It’s a truly broken system. I always answer 10 for call center employees, because often they’re not empowered to actually fix anything, and answering anything else often hurts that person instead of shedding light on the broken system they’re stuck in.”
“It feels very real as I read the long winded customer support ticket, feeling the user frustration, and finding the root cause and resolving the issue... Afterwards, internally trying and pushing for changes that would prevent the frustrations and escalations is also very rewarding.”
“We're getting internal comments on the Zendesk ticket from Pluno when the Jira ticket is updated. That back and forth communication is huge, and I haven't seen it personally in any other AI tools that we've explored.”
Customer-reported outcome: Jira escalations created the same day, instead of waiting days in the backlog
“...with Pluno right now they don't have to switch from one tool to another. They can keep focusing on one single tool, which will be Zendesk or Intercom, to communicate with merchants.”
Customer-reported outcome: Two-thirds of Slack escalations now created with Pluno
The common thread: people remember how quickly a problem was fixed and whether anyone dealt with the cause, and a survey score doesn't always capture either.
How Pluno helps support teams improve customer experience
Pluno is the AI agent for complex support. It works inside your existing help desk: Zendesk, Intercom, Salesforce Service Cloud, HubSpot, Jira Service Management or Freshdesk (see the integrations). It helps customers at onboarding, during everyday product use and when something breaks. It also gives the teams that own renewals and the product the evidence from your tickets, while your CX owners keep the strategy.
CX problems and how Pluno modules address them
| CX problem | What Pluno does | Module |
|---|---|---|
| Slow first replies, nights and weekends | Replies when its sources support a complete answer, asks for a missing detail or escalates, around the clock | Deflection AI |
| Incomplete answers from busy agents | Drafts a ready-to-send reply in the help desk sidebar, with the sources behind it and a ticket summary | AI Copilot |
| Technical tickets that bounce between teams | Investigates code, logs and error tracking, and returns the likely root cause and a recommended fix | Troubleshooting Agent |
| Bugs stuck with engineering while the customer waits | Files the escalation with the brief already written. Engineering updates reach the ticket as internal notes for your agent, and Pluno can suggest the customer reply for the agent to send | Escalation Copilot |
| Setup questions asked from inside the product | Checks the user's configuration, answers and makes changes once the user confirms | Product Agent |
| No clear view of what customers write in about | Fills contact-reason fields on new tickets and groups tickets into topics with trends over time | AI Tagging & Field Filling, Topics & Trends |
| Support quality you can't see | Scores eligible solved tickets against your own rubric, including tickets nobody rated | Quality Assurance |
When Pluno is the right choice
Choose Pluno when your hardest tickets are technical and account-specific, and the fix often sits with engineering. The case for it is the combination on one platform:
- It runs inside your help desk, so agents and customers stay where they are.
- It investigates technical issues across code, logs and error tracking with the Troubleshooting Agent, before anyone escalates.
- It runs the engineering escalation loop. Escalation Copilot files issues in Jira or Linear, or posts to Slack or Microsoft Teams, with the evidence attached, and brings the updates back to the ticket.
- It helps inside your product with the Product Agent, at the moment a user gets stuck.
- Its pricing is published and modular, so you pay for the modules you use.
After an escalation, Pluno watches both the ticket and the engineering issue. Updates reach your agent as internal notes, and Pluno can suggest the customer reply for the agent to send. In hybrid mode, it relays the update to the customer itself and passes the customer's answers back to the team. That targets principle 6, closing the loop, which is where many escalations go quiet.
Other AI agents, such as Forethought, also learn from past tickets. My Forethought review compares the two in detail.
The integration ticket from the introduction, revisited
Here's how the opening example could run with Pluno in place. It's an illustrative flow, not a customer case:
- The ticket: "Our CRM sync stopped updating contacts."
- First reply: AI Copilot surfaces four past tickets with the same error and the sync documentation, and drafts a reply with those sources. The agent checks them against this account's setup, which uses a custom field, and sends the configuration-specific part for investigation.
- The investigation: the Troubleshooting Agent checks the error tracking and recent deploys, and links the failures to a change in how the sync handles a custom field.
- The escalation: Escalation Copilot files a Jira issue with the account, the error, the steps to reproduce and the suspected cause. Engineering's updates reach the ticket as internal notes, and Pluno drafts the customer update for the agent to send.
- The pattern: AI Tagging & Field Filling sets the journey stage, contact reason and suspected cause (here: "use" stage, CRM sync, product bug). The agent confirms the cause, so the monthly CX review sees how many accounts it touched.
It works inside your product, too
The Product Agent brings the same help to the "use" stage, inside your own product. It reads the user's current setup before answering and can complete tasks such as exports once the user asks.
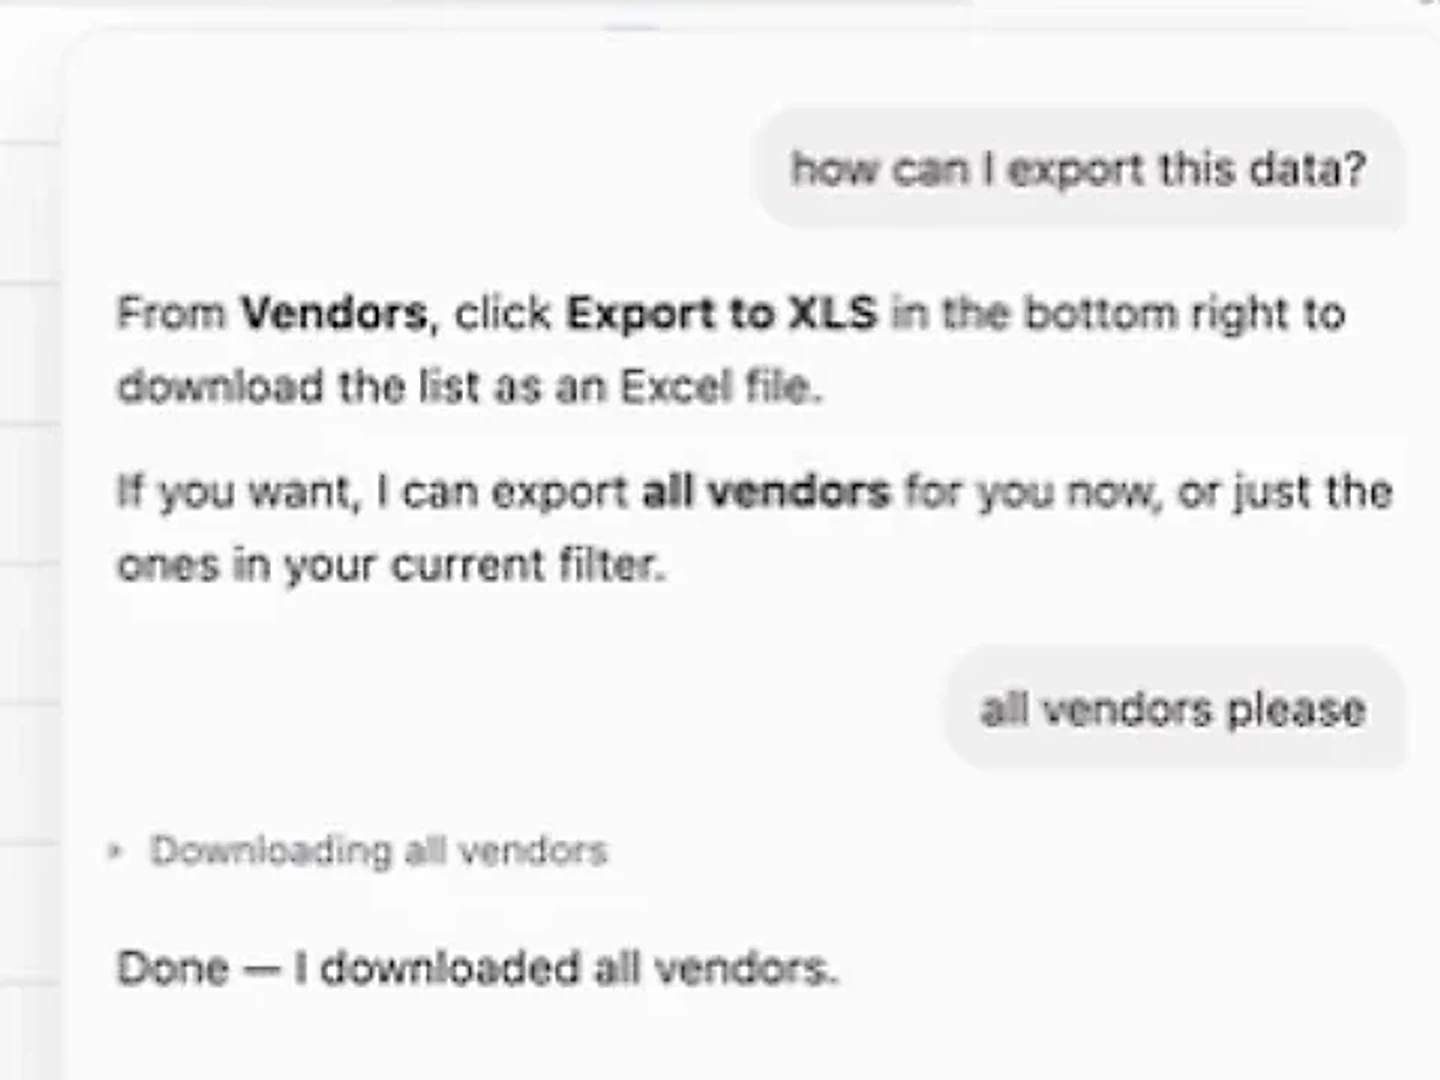
Sandbox demo, recorded in a test workspace of a contractor management app: the user asks, confirms "all vendors please", and the Product Agent runs the export.
What teams report
- Lightspeed ran a two-month live pilot, then rolled Pluno out to about 100 support agents across Zendesk and Intercom in two to three weeks. Two-thirds of its Slack escalations are now created with Pluno (story published October 2026). Aurélien Meinder, Manager Customer Experience Operations, calls it "the tool beside you every day."
- Innovorder reported a 15-point CSAT increase over one year in its February 2026 interview, and its support lead credited faster first answers as one contributor. From January 10 to February 10, 2026, Pluno resolved 67% of its chat and WhatsApp tickets.
- Smartness cut its first response time from hours to 22 minutes (December 2025).
- Kojo, with a five-person team, reports 30% to 50% ticket deflection and same-day Jira escalations (February 2026).
Pricing, as listed on the Pluno pricing page on November 11, 2026: your bill is a platform fee plus the modules you choose: AI Copilot seats, Deflection AI resolutions, Quality Assurance agents and credit plans.
- Platform fee: based on ticket volume, from 249€ a month (210€ a month billed annually) for up to 500 tickets. It covers AI Tagging & Field Filling, Escalation Copilot, ticket trends and topic insights, and ticket and call summaries.
- AI Copilot: 49€ per seat a month on monthly billing, or 41.65€ a month billed annually.
- Deflection AI: 0.90€ per resolution, meaning a ticket Pluno resolved without a human getting involved.
- Quality Assurance: 35€ per agent a month.
- Troubleshooting Agent: a monthly credit plan from 99€ for 4,000 credits.
- Product Agent: a monthly credit plan you arrange with the Pluno team. See how Product Agent credits work.
Pluno offers a 14-day free trial, and new workspaces receive 4,080 free Troubleshooting Agent credits.
My recommendation: if your customer experience suffers on technical, account-specific tickets, the kind that need past fixes, logs and engineering, Pluno is built for that part of the journey. Run the free simulation on your 50 most recent tickets and score it the way you'd score a new agent:
- Use one rubric for every ticket: is the answer correct, is it complete, and would you send it as it is?
- Check every handoff decision: should Pluno have answered, asked the customer for a detail or escalated?
- List the knowledge gaps it shows, and close them before anything goes live.
Pluno only has the access you grant. It anonymizes past tickets before storing them as knowledge, and no AI models are trained on your data. See security and compliance for the details.
The bottom line
Customer experience is how customers perceive every interaction with your company, across the whole journey, and in B2B SaaS the verdict arrives at renewal. Support shapes onboarding, everyday use and issue resolution, and feeds evidence into renewal and product decisions, which makes the support queue a strong place to start.
Measure it with surveys, behavior and product adoption, size what poor CX costs with your own churn reasons, and fix the three friction points with the highest risk first. Then tell customers what changed.
If complete first answers and faster escalations are where your customer experience is stuck, request a free 50-ticket simulation. We compare Pluno's draft replies and handoff decisions with the replies your team actually sent. The simulation runs offline and sends no replies to customers, and the scoring steps above show how to judge it.
Prefer a walkthrough first? Book a demo instead.
FAQ
What is customer experience in simple words?
Customer experience is how customers feel about your company after every interaction with it, from the first visit to your website to buying, using the product, getting support and renewing. It's judged by the customer, so it includes moments you don't measure, such as a confusing invoice or an outage.
What does CX mean, and what does CX stand for?
CX stands for customer experience. It's used for the overall experience a customer has with a company, and in job titles and team names such as Head of CX or CX operations. Some companies also call their support team "CX", which is narrower than the full meaning.
What is the difference between customer service and customer experience?
Customer service is every time your company helps a customer, such as answering a question or fixing a problem. Customer experience is broader: it includes every touchpoint, including the product, pricing, invoices and outages, even when no conversation happens. Good customer service is one part of a good customer experience.
What makes a good customer experience?
A good customer experience solves the problem, takes little effort and leaves the customer feeling respected. In practice, that means getting it right the first time, not making customers repeat themselves, being consistent across teams, telling customers about problems first, remembering their context and closing the loop on their feedback.
How do you measure customer experience?
Combine surveys with behavior. Use NPS for the relationship, CSAT or Customer Effort Score for interactions, repeat contact rate and time to resolution from your help desk, product adoption for customers who never write in, and gross and net revenue retention for the outcome. Segment each one by account size and journey stage.
What are the 3 main components of customer experience?
Forrester's CX Index measures three dimensions: effectiveness (did the customer get what they needed), ease (how much effort it took) and emotion (how the experience made them feel). The same three questions work for a single support ticket and for a whole account.
What are the 5 C's of customer experience?
There's no single standard list, and versions differ by author. Call Centre Helper's five C's of customer service, for example, are care, competence, culture, consistency and communication. Treat any list as a checklist, and measure the experience with real metrics.
What is customer experience management?
Customer experience management (CXM) is the ongoing practice of measuring the experience, finding what hurts it and fixing it across teams. It combines data (surveys, tickets, product analytics and revenue), a regular cross-team review and named owners for each stage of the customer journey.
What is a customer experience strategy?
A customer experience strategy is a written plan for which experiences you'll improve, for which customers, in what order and how you'll measure the result. A practical version names an owner per journey stage, uses tickets as voice of the customer data and ranks fixes by severity, the accounts affected and the effort to fix.
How can I improve customer experience?
Start with the support queue, where you have the most data. Answer completely the first time, carry context through every handoff, make engineering escalations complete and report back, and fix your top three repeat contact reasons at the source. Then close the loop with the customers who raised them.
How can a B2B SaaS team improve customer experience without changing help desks?
Add an AI layer inside the help desk you already use. Pluno runs in Zendesk, Intercom, Salesforce Service Cloud, HubSpot, Jira Service Management and Freshdesk. It answers tickets when its sources support a complete answer, drafts replies with sources for agents, investigates technical issues and escalates to engineering with the evidence attached. Lightspeed put about 100 agents on it in two to three weeks after a two-month pilot (story). A free 50-ticket simulation shows how Pluno would have answered your own tickets.
What is an example of good customer experience?
A customer reports a bug, and support replies the same day with a workaround, escalates to engineering with everything needed to reproduce it, and writes back when the fix ships. The customer never has to chase or repeat themselves, so a problem turns into a reason to trust you.
What is the difference between CX and UX?
User experience (UX) is the experience of using the product itself: how easy it is to find a feature or finish a task. Customer experience (CX) covers every touchpoint, including UX, sales, billing, onboarding and support. A product can have great UX and still deliver poor CX if, for example, support is slow.
What is the difference between CX and CRM?
A CRM (customer relationship management system) is software for storing account data, contacts, deals and history, such as Salesforce or HubSpot. CX is what the customer perceives. A CRM can support a better experience by giving every team the same account history, but it doesn't create one on its own.
How does AI improve customer experience?
AI can answer common and repeat questions around the clock, draft replies with sources for agents, tag tickets so you see trends early and investigate technical issues faster. It improves the experience only when it answers from evidence, hands over to a person when needed and is measured separately from human-resolved tickets.