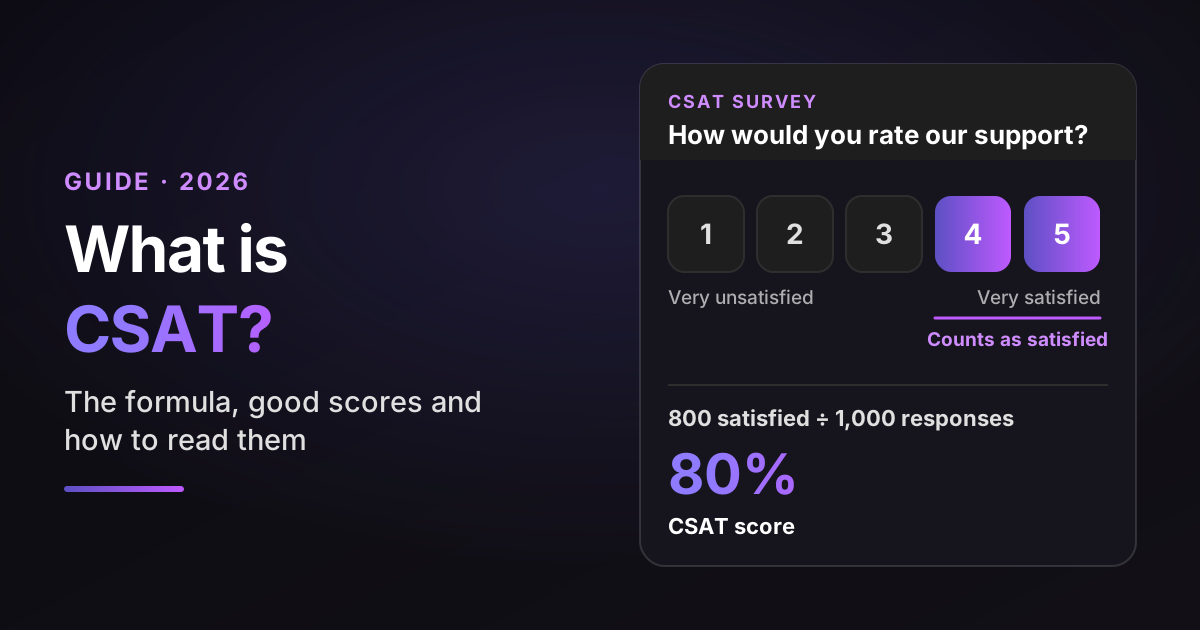
Here's the formula behind that definition: CSAT = satisfied responses ÷ all valid responses × 100. If 800 of 1,000 valid responses are a 4 or a 5, your CSAT is 80%. Jump to the CSAT calculator to run your own numbers.
Now the harder part. Say your CSAT moved from 86% to 82% last month, and your VP wants to know why by Friday. You open the neutral and negative ratings. Half of them say some version of "the export bug is still there," and one says "the agent was lovely, the product is broken."
Is your team getting worse? Maybe not. A 4-point move on a few hundred ratings may not be distinguishable from sampling error, and many negative ratings are about the product, not the support. This guide covers how to calculate a CSAT score, how to read benchmarks and how to interpret your score before you act on it.
TL;DR
- CSAT meaning: CSAT stands for customer satisfaction score: the percentage of valid survey responses marked satisfied with a support interaction, usually a 4 or 5 on a five-point scale.
- The formula: satisfied responses ÷ all valid responses × 100. With 800 ratings of 4 or 5 out of 1,000 valid responses, your CSAT is 80%. An average rating (here, 4.18 out of 5) is a different number.
- Benchmarks are context, not targets: Freshdesk reported a median CSAT of 80% for Software & IT in its 2021 dataset (vendor research). Set your target from comparable queues, channels and survey rules in your own data.
- The trap: help desks calculate CSAT differently, and small samples swing. At 85% on 200 ratings, the 95% Wilson confidence interval runs from 79.4% to 89.3%. The calculator below shows the interval for your numbers and tests a change between two periods.
- How to use CSAT well: read it per interaction, segment it, and pair it with signals that cover what the survey misses: survey coverage, response rate, quality reviews, repeat contacts and account churn.
- Bottom-line advice: every week, read the neutral and negative ratings (1 to 3), tag each one as support, product or policy, and report CSAT for AI-resolved tickets, human-resolved tickets and AI-to-human handoffs separately.
Where Pluno fits: Pluno is the AI agent for complex support. It works inside your existing help desk, answers what it can with sources, investigates technical issues and hands the rest to your team with its findings. For CSAT, that means faster, more complete first answers, plus quality scoring on eligible solved tickets, including the ones nobody rated. Innovorder reported a 15-percentage-point CSAT increase over one year, and its support lead credited faster first answers as one contributor.
Sources: vendor reports and vendor documentation are labeled as such, published studies link to the journal or abstract, and calculations and example tickets are illustrative. I checked each help desk's survey settings and scoring rules in its public documentation on November 9, 2026, and give plan names only where those docs state them.
Disclosure: I work at Pluno. We make an AI agent for complex support that runs inside the help desk and resolves, drafts and escalates tickets.
CSAT meaning: what a CSAT score tells your support team
CSAT means customer satisfaction score: the percentage of valid survey responses that say the customer was satisfied with a specific interaction. Support teams usually collect it with a one-question survey right after a ticket is solved, so it captures how one experience felt while it's still fresh.
The standard definition is the same across the sources I checked. IBM and Qualtrics both count ratings of 4 or 5 on a five-point scale as satisfied, divide by all responses and multiply by 100.
For a support team, that gives you three things:
- A read on each interaction, tied to a ticket, an agent, a channel and a contact reason.
- The customer's own words. The comment under a negative rating often tells you more than the number.
- An early warning. A falling score on one contact reason can flag a bug or a broken process before renewals show it.
What does CSAT stand for?
CSAT stands for customer satisfaction score, sometimes written as customer satisfaction or CSAT score. This guide uses it in the customer support sense: a survey-based score for a support interaction.
What CSAT measures, and what it doesn't
The customer satisfaction score measures how satisfied a customer felt about one interaction. It doesn't measure loyalty, how hard the customer had to work or whether the agent followed your process. Those need other metrics, which I compare further down.
Interaction CSAT is also different from product CSAT. A post-ticket survey asks about the help the customer got; a product or journey survey asks about the product or a stage such as onboarding. Keep them as separate scores, because they answer different questions.
And it only covers people who answered. That's the biggest limit of the CSAT score, and the reason this guide spends time on reading it, not just calculating it. My guide to customer service metrics shows where CSAT sits in a full support scorecard.
How to calculate a CSAT score: the formula with examples
To calculate CSAT, divide the number of satisfied responses by the total number of valid responses and multiply by 100. On a five-point scale, satisfied means a 4 or a 5.
CSAT = (ratings of 4 and 5 ÷ all valid ratings) × 100
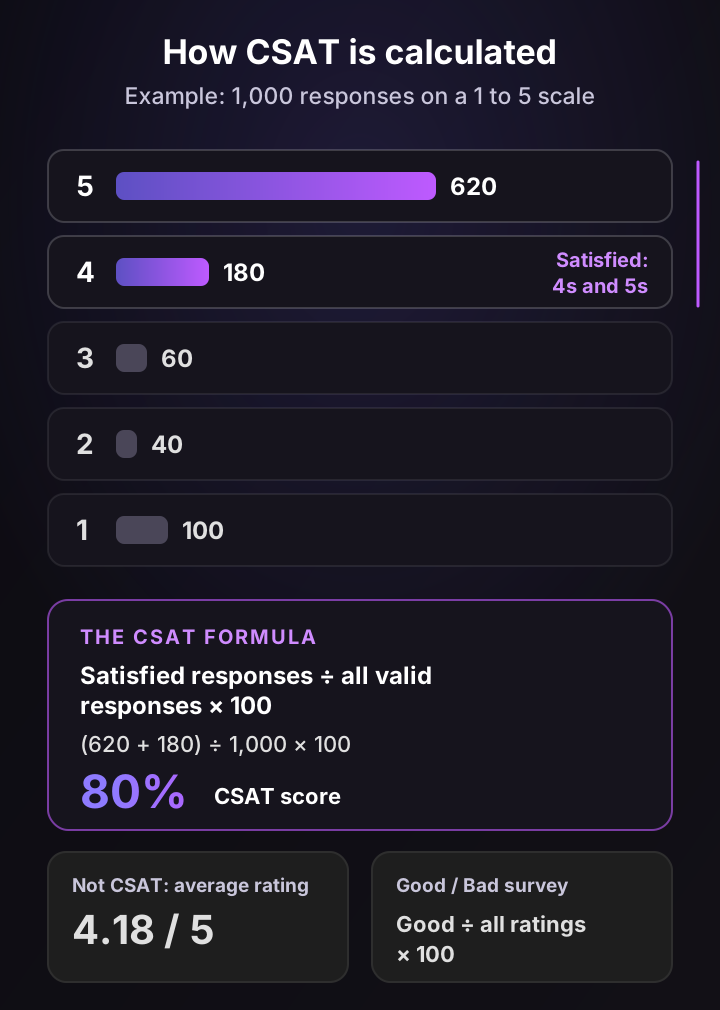
Calculating CSAT on a five-point scale
Say your team got 1,000 valid ratings last month:
| Rating | Responses | Counts as satisfied? |
|---|---|---|
| 5 (very satisfied) | 620 | Yes |
| 4 (satisfied) | 180 | Yes |
| 3 (neutral) | 60 | No: excluded from the numerator, kept in the denominator |
| 2 (unsatisfied) | 40 | No |
| 1 (very unsatisfied) | 100 | No |
Add the 5s and 4s: 620 + 180 = 800. Divide by 1,000 and multiply by 100. Your CSAT score is 80%.
Neutral ratings stay in the denominator. A neutral customer wasn't satisfied, and the metric is built to show it.
Calculating CSAT in a spreadsheet
Export one row per rated ticket, with the rating in column B, and use:
=COUNTIF(B2:B1001,">=4") / COUNT(B2:B1001)
With the 1,000 ratings above, that returns 0.8, or 80%. Keep the export: you need the raw rating counts for every other calculation in this guide, including the confidence interval.
Calculating CSAT on two-point and three-point scales
Shorter scales use the same idea, with a different line between satisfied and not:
- Good / Bad (two points): CSAT = Good ÷ (Good + Bad) × 100. Zendesk's legacy survey worked this way.
- Unhappy / Neutral / Happy (three points): CSAT = Happy ÷ all valid responses × 100. HubSpot's built-in survey uses these three options and reports the share of each.
- Seven or ten points: decide in advance which answers count as satisfied, write it down and never change it mid-year.
CSAT percentage vs average rating
Some tools report the average rating instead of a percentage. The same 1,000 responses above average 4.18 out of 5, while the CSAT is 80%.
The two move differently, and you can't convert one into the other. Two teams can both average 4.0 out of 5 with very different shares of 4s and 5s. To get a CSAT percentage from an average, you need the underlying count of each rating: add the 4s and 5s, then divide by all valid ratings.
Pick one, label it clearly and don't compare a percentage with someone else's average.
Which tickets to count
The formula is simple. Most errors come from what goes into it:
- Count valid responses, not customers. Most help desks rate per ticket, so one customer with five tickets can rate five times.
- Keep unanswered surveys out of the score. They belong in the response rate instead (valid responses ÷ surveys sent).
- Use the date the rating arrived, or the date the ticket was solved, consistently. Mixing the two moves ratings between months.
- Split AI-resolved tickets, human-resolved tickets and AI-to-human handoffs. A blended score describes none of them. There's a section on this below.
- Keep spam and test tickets out, but never remove a real negative rating because it "wasn't the agent's fault." Tag it instead.
CSAT calculator: check your score and compare two periods
Use this CSAT calculator two ways: enter your rating counts to get your score with its 95% Wilson confidence interval, or enter satisfied and total responses for two periods to test whether the change is statistically significant.
CSAT calculator: your score, its range and a two-period comparison
CSAT = satisfied responses ÷ all valid responses × 100. On a five-point scale, satisfied means a 4 or 5; on a two-point survey, Good. For any other scale, enter the count your survey defines as satisfied. The range is a 95% Wilson confidence interval: it covers sampling error only, not the bias of who chooses to answer. Response rate = valid responses ÷ surveys sent. These are your numbers, not benchmarks.
CSAT score
80.0%
800 satisfied of 1,000 valid responses
95% Wilson confidence interval
77.4% to 82.4%
Sampling error only
Average rating
4.18
Response rate: 16.7%
Your CSAT is 80.0%. With 1,000 responses, the 95% Wilson interval runs from 77.4% to 82.4%, before any non-response bias. Read the comments on neutral and negative ratings first: they show which part of the experience to fix.
With the default numbers, 800 satisfied ratings out of 1,000 give an 80% CSAT, with a 95% Wilson confidence interval of 77.4% to 82.4%. Switch to "Compare two periods" and the default move from 86.0% (344 of 400) to 82.1% (312 of 380) has a two-sided p-value of about 0.14. These samples provide insufficient evidence of a change under the test assumptions. Detecting a change of that size with 80% power would take about 1,380 ratings per period, assuming independent ratings and equal group sizes.
Here's how wide the 95% Wilson interval is for an 85% CSAT at different sample sizes:
| Satisfied of valid responses | 95% Wilson confidence interval |
|---|---|
| 34 of 40 (85%) | 70.9% to 92.9% |
| 85 of 100 (85%) | 76.7% to 90.7% |
| 170 of 200 (85%) | 79.4% to 89.3% |
| 340 of 400 (85%) | 81.2% to 88.2% |
| 850 of 1,000 (85%) | 82.7% to 87.1% |
| 1,700 of 2,000 (85%) | 83.4% to 86.5% |
If your team gets 150 ratings a month, a 5-point swing between months tells you very little on its own. Compare quarters, or look at the trend over several months, before you change a process or coach an agent. Agent-level CSAT is the hardest case: one agent's 30 ratings can move a long way on chance alone.
Three things the math can't fix:
- Who answered. The interval covers sampling error only, not the bias of who chose to respond. That's the first blind spot below.
- Repeat respondents. The test assumes every rating is independent. A few customers rating many tickets weakens that assumption.
- A change in ticket mix. If one period had a bug spike or a new channel, you're comparing different populations. Segment first.
What is a good CSAT score? Benchmarks and their limits
A good CSAT score is one that beats your own baseline on the same survey, for comparable queues, channels and tickets. Published support benchmarks can give historical context, but they're old, vendor-run and built on different survey scales.
I checked each benchmark below on four yardsticks: who published it, when the data is from, the sample and the scale.
| Benchmark | Data from | Sample | What it reports |
|---|---|---|---|
| Freshdesk Customer Service Benchmark Report (vendor research) | 2021 | Over 1.1 billion tickets from about 40,000 Freshdesk customers | Median CSAT 79.4% across industries; Software & IT 80%; Education 86.4%; E-commerce 76.3%; Travel & Hospitality 71.4% |
| Zendesk Benchmark report (vendor research, historical) | Q1 2014 | 16,000+ companies, Good/Bad ratings | 81% across industries; Software 83%; Web Applications 83% |
How to use these:
- Treat Freshdesk's 80% as historical context. It's the median for Software & IT in one vendor's 2021 dataset, not a norm for your segment or a recommended target.
- Industry matters. Freshdesk's range runs from 71% in travel to 86% in education, so a cross-industry figure is a weak target for any team.
- Scale changes the number. A Good/Bad survey and a five-point survey of the same customers won't give the same score.
A separate example shows why the format matters. Comm100's 2026 report on 220 million+ live chats (vendor research) gives an average chat rating of 4.1 out of 5. That's an average for one channel, not a CSAT percentage, so it can't sit next to the figures above.
So what should you aim for? Set a target from your own last two quarters, per contact reason and channel, and judge the trend. A team at 92% that slides to 88% may have a bigger problem than a team climbing from 78% to 82%, if the change holds up in the calculator above.
How to write a CSAT survey customers answer
A practical CSAT survey asks one rating question about the interaction that just ended, sends it soon after the ticket is solved and gives unhappy customers room to explain. Here's a starting point:
How satisfied were you with the support you received on this request? 1 Very unsatisfied · 2 Unsatisfied · 3 Neutral · 4 Satisfied · 5 Very satisfied
Shown for ratings of 1 to 3: What could we have done better?
If you also want to learn what worked, offer an optional comment box across the full scale instead.
Two copy-ready versions:
- Post-chat: "Thanks for chatting with us. How satisfied were you with the help you got today?" (five-point scale, then an optional comment)
- Solved-ticket email: "We've marked your request #{ticket number} as solved. How satisfied were you with the support you received?" (five-point scale in the email, comment on the landing page)
The choices behind it:
- Name the interaction, not the company. "This request" keeps the rating about support. "How satisfied are you with us?" invites a rating of your pricing or your roadmap.
- Use one scale and keep it. A five-point scale gives you more detail than Good/Bad, but changing scales resets your trend line. Freshdesk, for one, locks a legacy survey's scale once the first response comes in.
- Ask a follow-up after negative ratings. Zendesk's updated CSAT does this, with an optional open question and an optional list of reasons for negative ratings.
- Send it while the memory is fresh. Zendesk sends email surveys one day after a ticket is solved by default and shows messaging surveys immediately.
- Survey once per solved ticket. Surveying every reply fills your data with half-finished conversations.
Track two rates, by channel and by who resolved the ticket:
- Survey coverage = surveys sent ÷ eligible interactions. It shows which tickets never got a survey.
- Response rate = valid responses ÷ surveys sent. It shows how much of the surveyed group you're hearing from.
I didn't find a reliable, independent CSAT response-rate benchmark, so I won't quote one. Intercom's own documentation says CSAT response rates are low and that feedback "tends to reflect only extreme experiences." Treat a falling response rate as a warning sign of its own.
A line that helps: tell customers a survey is coming and that you read it. What doesn't help is asking for a 5, which inflates the score and makes it useless for spotting problems.
How 6 help desks measure CSAT, compared
These six help desks use different scales, triggers and reporting rules. That's why a "CSAT" figure from one tool can't be compared directly with another.
I compared them on the same four yardsticks: the scale, when the survey is sent, how the score is reported and how AI feedback is collected and reported. AI feedback measures differ from each other, too, so read the last column as "what exists," not "the same metric."
| Help desk | Scale | When it's sent | How the score is reported | AI feedback and reporting |
|---|---|---|---|---|
| Zendesk | 1 to 2, 1 to 3 or 1 to 5, as numbers, emoji or text (legacy: Good/Bad) | Email: one day after the ticket is solved, by default. Messaging: right after it's solved | Share of rated tickets rated good; on 1 to 5, a 4 or 5 is good | BSAT (AI agent satisfaction): a five-point rating, messaging only. Trigger-based BSAT prompts skip conversations escalated to a human |
| Intercom | Five emoji, from Terrible to Amazing | About 10 seconds after a teammate closes the conversation | Great and Amazing ÷ all ratings ("Bad" counts as neutral, not negative) | Fin CSAT from Fin's own ratings. Fin can ask before a handoff, and the teammate can be rated after closing |
| Salesforce Service Cloud | You build the survey (stars, emoji, numbers, NPS and more) | Email link when a case closes, or on your own rules with Flow | No fixed CSAT formula; you build the reports | Agentforce collects thumbs-up and thumbs-down feedback on responses. That's a different measure from a case survey |
| HubSpot (Service Hub Professional or Enterprise) | Unhappy, Neutral, Happy | Email and web surveys use configured targeting. Chat surveys can appear after the selected chat closes. Verify ticket-close criteria in your workflow | Share of happy, neutral and unhappy responses | Customer Agent reports show the share of visitor feedback rating the agent helpful. A dedicated post-resolution survey score wasn't found in the docs I checked |
| Jira Service Management | 1 to 5 stars | In the notification when a request moves to Done | Average rating, not a percentage | The virtual service agent shows the average CSAT for conversations it resolved |
| Freshdesk (legacy and upgraded CSAT) | Legacy: 2, 3, 5 or 7 points. Upgraded: up to 10 points | Legacy: on resolve or close, with every reply, or when the agent chooses. Upgraded: on resolve or close, per channel, with a delay | Legacy: share of positive answers (on 5 points, the top two). Upgraded: positive, neutral and negative groups you define | The AI and Human Agent Impact Analysis report covers CSAT alongside handovers |
What this means in practice:
- Intercom's CSAT is a standard top-two score, but only "Terrible" counts as a negative rating, so its share of negative ratings looks lower than a bottom-two count of the same answers.
- Jira Service Management's 4.3 stars isn't 86%. An average can't be turned into a CSAT percentage. Use the count of each star rating from a report or export: add the 4s and 5s, then divide by all valid ratings.
- A migration can break the trend when the question, scale, trigger or reporting population changes. Preserve the survey setup where possible, retain the raw ratings, and run an overlap pilot if a change is unavoidable.
If you report CSAT to leadership, write the definition next to the number: the scale, what counts as satisfied and which tickets are included.
CSAT vs NPS vs CES vs QA score: which metric answers which question
CSAT tells you whether a customer was satisfied with one interaction. Net Promoter Score (NPS) measures willingness to recommend and can serve as a relationship indicator, Customer Effort Score (CES) shows how hard it was to get help, and a QA score checks a conversation against your internal rubric.
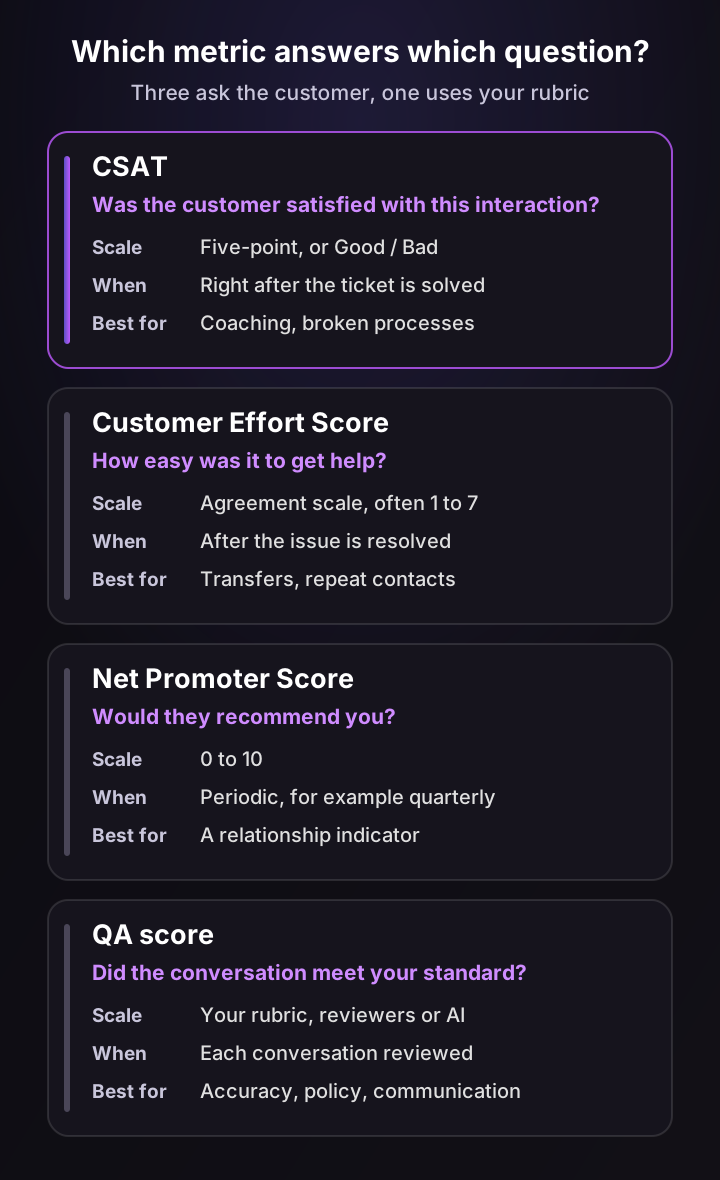
| CSAT | Customer Effort Score | Net Promoter Score | QA score | |
|---|---|---|---|---|
| Asks | Was the customer satisfied with this interaction? | How easy was it to get the issue handled? | How likely is the customer to recommend you? | Did the conversation meet your standard? |
| Scale | Five-point, or Good/Bad | Agreement scale, often 1 to 7, with scoring defined by the survey | 0 to 10 | Your rubric |
| Formula | Satisfied ÷ all valid responses × 100 | Defined by the survey, often the share who agree | % promoters (9 and 10) minus % detractors (0 to 6) | Points scored ÷ points possible |
| When | Right after a ticket is solved | After the issue is resolved | Periodic, for example every quarter, per account | On each conversation you review |
| Covers | Customers who answer | Customers who answer | Customers who answer | Every conversation you review |
| Best for | Coaching, broken processes, contact reasons | Transfers, repeat contacts, self-service gaps | Relationship health and renewal risk | Internal rubric criteria such as technical accuracy, policy compliance and communication quality |
Where each one comes from:
- NPS was introduced by Fred Reichheld in "The One Number You Need to Grow" in 2003. Bain's definition subtracts the percentage of detractors (0 to 6) from the percentage of promoters (9 and 10).
- CES came out of research by CEB, published as "Stop Trying to Delight Your Customers" in 2010, which argued that reducing effort does more for loyalty than delighting customers.
- QA scores are internal. They're the only one of the four that can cover conversations where the customer never answered a survey.
CSAT vs NPS for support teams: keep NPS on the company scorecard and use CSAT for support. A customer can rate your agent a 5 and your company a 2 in the same week, because NPS also reflects price, product and the account relationship.
My pick for a B2B SaaS support team is CSAT plus QA scoring on solved tickets, with CES added once self-service and AI handle a real share of your volume. My guide to Zendesk QA covers quality scoring in detail.
5 blind spots in your customer satisfaction score
CSAT only sees customers who were surveyed and chose to answer, and it can't tell support problems from product problems. Each blind spot needs its own signal.
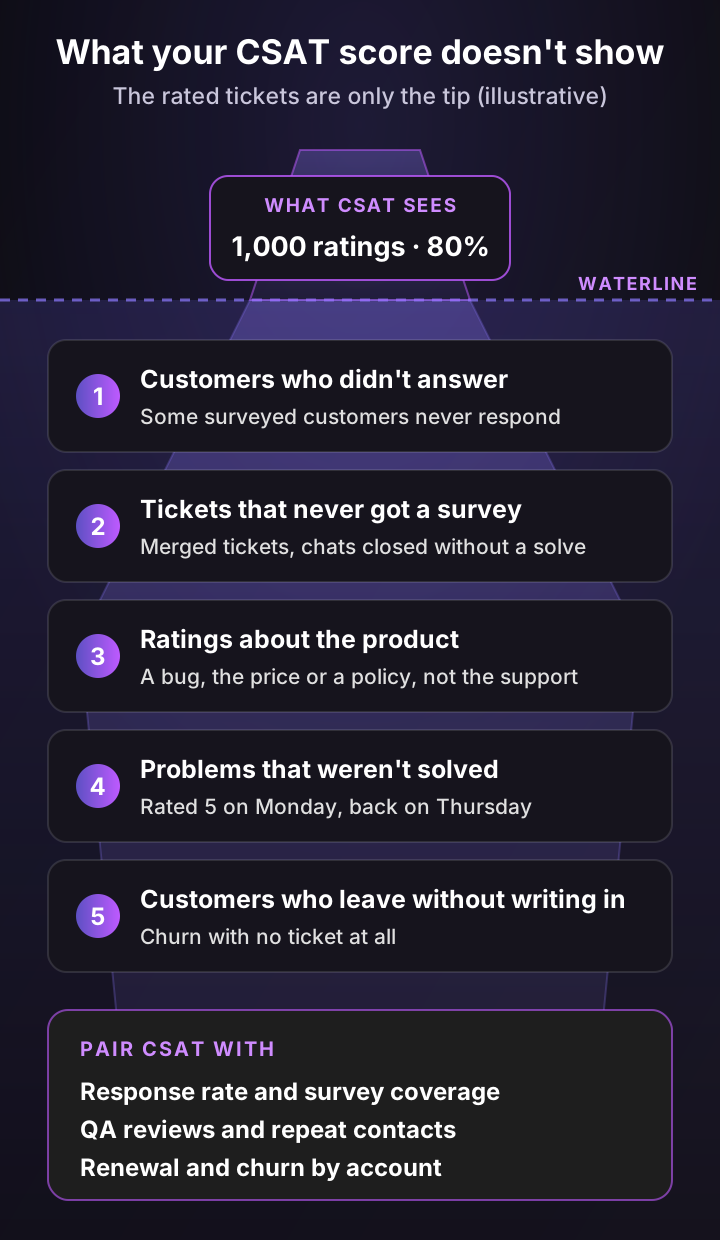
| Blind spot | Signal to watch |
|---|---|
| Customers who didn't answer | Response rate, by channel and segment |
| Tickets that never got a survey | Survey coverage: surveys sent ÷ eligible interactions |
| Ratings that are really about the product | QA reviews and the ticket itself |
| Problems that weren't solved | Repeat contact rate |
| Customers who leave without writing in | Account-level renewal and churn data |
1. Customers who didn't answer
The people who answer surveys aren't a random sample. As one illustration from healthcare, a study of patient satisfaction surveys found that response bias could lead to overestimating satisfaction, most of all for the lowest-scoring providers. Support surveys are a different setting, but the mechanism is worth checking for.
What to do: track the response rate by channel and segment. If enterprise accounts answer half as often as self-serve users, your CSAT mostly describes self-serve users.
2. Tickets that never got a survey
Merged tickets, tickets closed by an automation, chats that ended without a solved status and conversations handled only by AI may never trigger a survey. If those are your messiest tickets, the score looks better than the experience.
What to do: track survey coverage by ticket type and by who resolved the ticket.
3. Ratings that are really about the product
A customer who hits a bug, a missing feature or a pricing rule often rates the agent who delivered the news. The score falls, the agent gets coached and nothing changes for the customer.
What to do: tag every negative rating with a reason (support, product or policy), check it against a QA review of the ticket, and send the product share to your product team with ticket links, not percentages.
4. Problems that weren't solved
A friendly, fast reply that doesn't fix the problem can earn a 5 on Monday and a new ticket on Thursday. CSAT rates the reply; it can't see the second ticket.
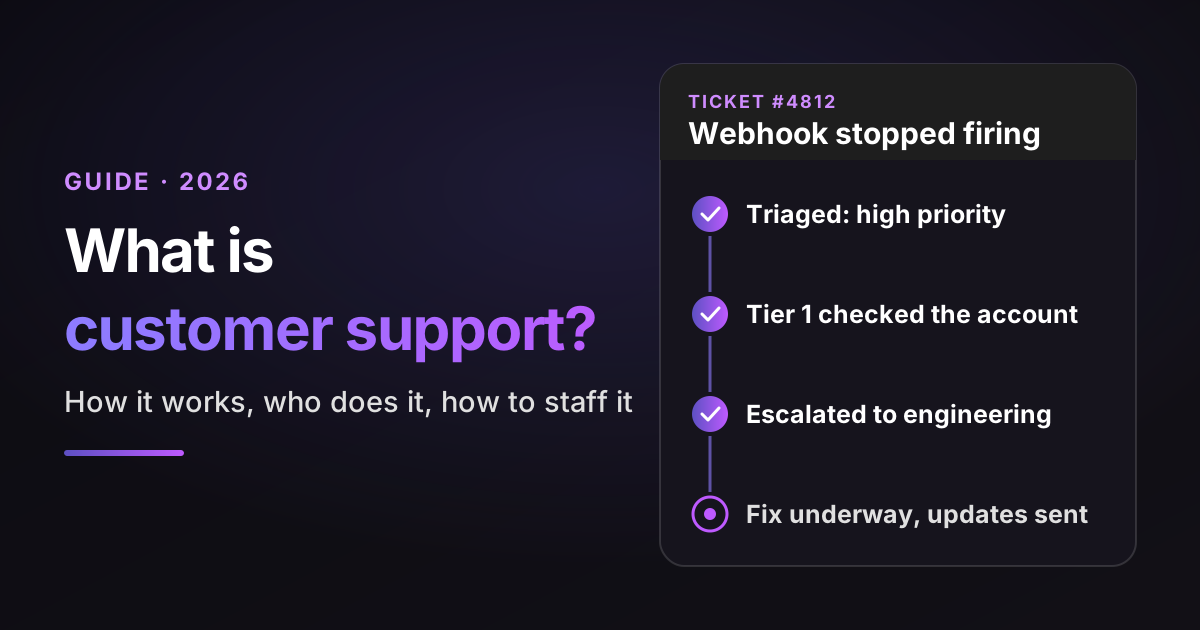
What to do: track the repeat contact rate (the same customer, the same issue, within 7 days) next to CSAT, and look at CSAT on the second contact.
5. Customers who leave without writing in
Some customers never contact support before they churn, and some rate one ticket well and leave anyway. No support survey can see them.
What to do: join CSAT with account data. A negative rating on an account with a renewal in 90 days goes to the account owner the same day, and churned accounts get a look at their ticket history.
How to read your CSAT: a 30-minute weekly review
Read CSAT by segment and by comment, not as one number. A weekly review of your neutral and negative ratings tells you more than any dashboard.
Here's the routine I'd run:
- Pull the neutral and negative ratings (1 to 3) from the past week, with the ticket link, contact reason, channel, agent and who resolved it (AI, human or an AI-to-human handoff).
- Read the comment and the ticket, not just the rating.
- Tag the cause with one of five labels: slow or waiting, wrong or incomplete answer, tone, product or bug, policy or pricing.
- Count the labels. Support owns the first three. Product owns bugs. Leadership owns policy.
- Pick one fix per owner and check the same label next week.
On a high-volume team, review every rating of 1 and 2, then a fixed random sample of the 3s, so the review still fits in 30 minutes.
A worked example
Here's what that looks like for an illustrative 18-agent SaaS team with 100 neutral and negative ratings in a month:
| Cause of the rating | Ratings | Primary owner | One fix |
|---|---|---|---|
| Product or bug | 38 | Product | Escalate the top two bugs with ticket links and affected accounts |
| Slow or waiting | 24 | Support | Send an update every 24 hours on escalated tickets |
| Wrong or incomplete answer | 17 | Support | Fix the three articles behind most wrong answers |
| Policy or pricing | 13 | Leadership | Review the refund rule behind most of these |
| Tone | 8 | Support | Coach the two agents with repeat tone ratings |
Support is the primary owner for 49 of the 100 ratings. If this team had coached agents on the whole drop, it would have missed the 38 ratings that needed a product fix and the 13 that needed a policy change.
My customer service metrics guide has a second worked example, for diagnosing a sudden CSAT drop by segment.
8 ways to improve your CSAT score
You improve CSAT by fixing the causes behind negative ratings: unresolved issues, waiting and wrong answers. Asking customers for better scores doesn't count. These eight practices target the causes that usually show up in a SaaS queue.
- Resolve on the first contact. A customer who has to write back is less likely to rate you well. Track first contact resolution next to CSAT.
- Make the first answer complete. Ask for logs, account IDs and screenshots in your first reply when the issue needs them, so the second reply can solve it.
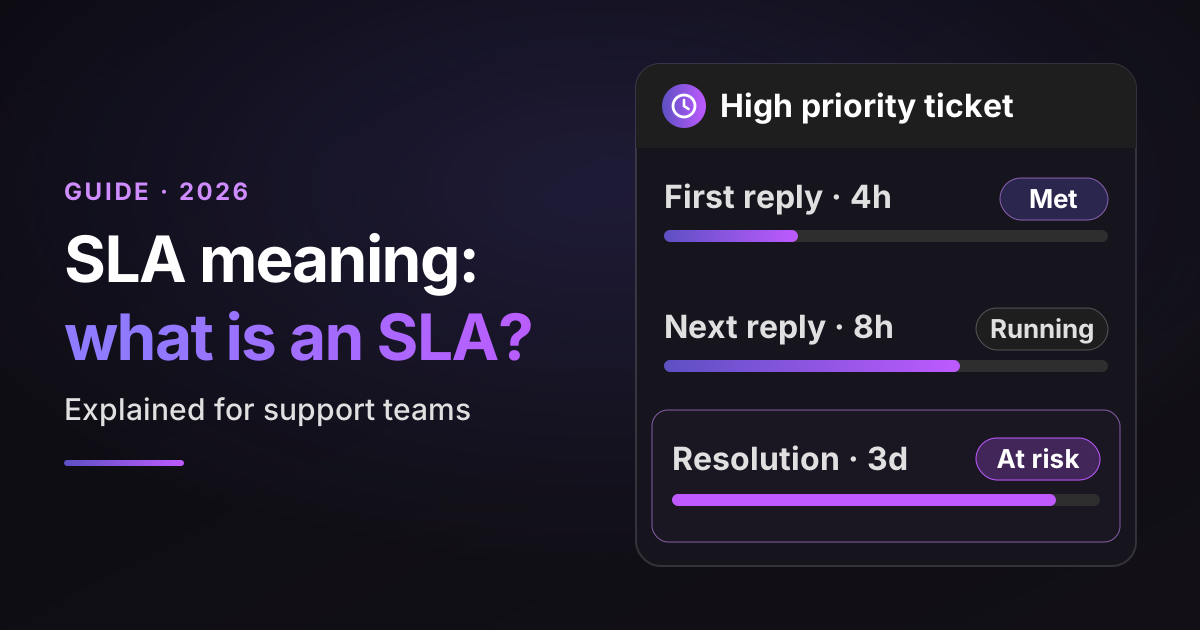
- Update customers while they wait. Tickets waiting on engineering cause many of the worst ratings. A short update every day or two, with what's happening next, turns silence into progress. My guide to SLAs covers how to set those update targets.
- Follow up on every 1 or 2 within a day. A manager reply that says "you're right, here's what we're doing" can save the account and often reopens the conversation.
- Send product feedback with evidence. A list of ticket links for one bug is what gets it fixed. "Customers are unhappy" doesn't get prioritized.
- Coach with quality reviews, not CSAT alone. Agent-level CSAT is noisy and includes product frustration. Use it as a prompt to look at tickets, not as a grade.
- Never ask for a 5, and don't tie individual pay to CSAT. Both push agents to manage the survey instead of the customer. You'll see the effect in the quotes below.
- Hand off from AI cleanly. If AI can't solve the issue, it should pass the ticket to a person with everything it found, so the customer never repeats themselves.
AI help for agents also has peer-reviewed evidence behind it, though for productivity rather than CSAT. In a study of 5,172 customer-support agents published in the Quarterly Journal of Economics, access to a generative AI assistant increased issues resolved per hour by 15% on average. The authors also report that customers were more polite and less likely to ask for a manager, which is conversation behavior, not survey CSAT.
How to measure CSAT for AI-resolved tickets and handoffs
Measure CSAT for three cohorts separately: tickets AI resolved, tickets humans resolved and tickets AI handed to a human. Compare them by contact reason, channel and survey exposure, and read them next to the reopen and repeat contact rates. A blended score describes none of them.
AI feedback in help desks often measures a different group than human CSAT does:
- Zendesk BSAT is a five-point rating for AI agents, in messaging only. When it's sent by a trigger, conversations escalated to a human don't get it, so BSAT describes AI-only conversations.
- Intercom can ask for a Fin rating before a handoff and a teammate rating after the conversation closes, so one handoff can produce two ratings about different parts of the experience.
- Jira Service Management reports an average rating for conversations its virtual service agent resolved, not a percentage.
For each cohort, publish four counts: eligible conversations, surveyed conversations, rated conversations and satisfied ratings. Without the first three, you can't tell whether a CSAT difference comes from the experience or from who got asked.
Expect AI to be rated differently. Intercom's documentation says AI support is often rated more harshly than human-led conversations, and that customers may be rating the whole experience rather than one reply. In a Gartner survey of customers, only 27% said they would try a chatbot again after a negative experience.
Three rules keep the comparison honest:
- Make sure AI-resolved tickets receive a survey. If your AI conversations end without a solved status, they may never get one.
- Compare like with like. AI usually takes the simpler tickets first, so compare CSAT for the same contact reasons, not the overall averages.
- Watch the reopen rate. A customer who gives up on an AI answer may not rate it, but they often come back.
My guides to chatbots and customer support automation cover how to roll AI out ticket type by ticket type.
My recommendation: for B2B SaaS support teams handling technical tickets in an existing help desk, I recommend Pluno when the priority is to investigate issues across connected systems, send engineering a report with the findings, and audit the outcome in the support workflow. If you're also looking at Forethought AI agents by Zendesk, my Forethought comparison covers the differences. Test both on the same tickets and score them on correct resolution, false closures and how complete each handoff is.
What support teams say about CSAT
These are selected comments from people who have worked in or around support, posted on Hacker News. They're anecdotes, not representative research, but they show how CSAT feels from the queue: rated for things agents can't control, pushed for perfect scores and most useful when someone reads the comments.
“Day 5 is marketing/product telling them that this is Working as designed ... they know you are going to give a bad CSAT/NPS survey and it's going to kill their metrics.”
“As someone who used to work in a technical support call center, I understand just how much control these metrics can have over someone. Anything less than a 10.0/10.0 CSAT was considered not good enough at times.”
“...a company struggling with customer satisfaction (CSAT) that looks just at KPIs, sees the entire team is in the green save CSAT, but customer satisfaction is getting worse and worse. ... the KPI for closed cases has been optimized for by the support team and emphasizes closing cases by any means instead of solving issues correctly”
“I used to read every single comment we received and even took the time to test and narrow down issues before working with a dev to find the root cause. We fixed some very nasty, but unusual bugs that way.”
The common thread: CSAT works when you read it as a signal about the whole experience, and breaks when you use it as a grade for one agent.
How Pluno helps you raise and diagnose CSAT
Pluno is the AI agent for complex support. It works inside your existing help desk: Zendesk, Intercom, Salesforce Service Cloud, HubSpot, Jira Service Management or Freshdesk (see the integrations). Keep your current CSAT survey, and validate delivery for each AI and human workflow before rollout. The docs explain how Pluno processes and protects your ticket data.
Better first answers on the tickets customers rate
- Deflection AI searches your past tickets, help center, docs and connected tools, then picks one of three paths. It replies when it has what it needs for a complete answer, asks the customer for a missing detail, and escalates when information is missing, ambiguous or contradictory, or a business decision is needed. See how deflection works.
- AI Copilot prepares a ready-to-send reply, a brief on what it found and the sources behind it in the help desk sidebar, so a complete first answer doesn't depend on which agent picked the ticket up.
- Troubleshooting Agent investigates code, logs and error tracking for technical tickets and returns the likely root cause and a recommended fix.
- Escalation Copilot files escalations in Slack, Jira, Linear, Microsoft Teams or incident.io with the report already written, and returns relevant updates to the ticket, which targets the "slow or waiting" ratings.
What this looks like on a negative rating
Here's an illustrative technical ticket, not a customer case:
- The ticket: "CSV exports time out for our biggest workspace."
- What the first response missed: the agent sent the general export article. The customer rated it 2: "Still broken. This is the third time I've asked."
- What Pluno would look up: past tickets with the same timeout, the error tracking events for the export job and the size of the customer's workspace. Together they point to exports over a row limit failing, not a setup mistake.
- The human decision: it's a bug, so the agent escalates. Engineering gets the affected accounts, the error and the steps to reproduce, and the customer gets a workaround and a date for the next update.
How Pluno helps you diagnose low CSAT
- Quality Assurance applies your QA rubric to eligible solved tickets, including conversations with no survey response, and explains each score by criterion. That helps you tell an agent problem from a product problem.
- Ticket sentiment: AI Copilot's ticket summary shows the customer's sentiment (positive, neutral or negative), based on their messages.
- AI Tagging & Field Filling can populate configured contact-reason and other active fields once filling at ticket creation is turned on, so you can segment CSAT by contact reason without relying on agents to tag.
- Separate AI and human cohorts. Pluno tags the tickets it handles, so you can build the three-cohort report in your own help desk:
| Cohort | How to find it | Eligible | Surveyed | Rated | CSAT |
|---|---|---|---|---|---|
| AI-resolved | pluno-resolved or pluno-resolved-chat |
1,200 | 1,150 | 180 | 84% |
| AI-to-human handoff | pluno-routed-to-team |
600 | 590 | 110 | 79% |
| Human-resolved | No Pluno resolution or routing tag | 1,800 | 1,780 | 320 | 88% |
Illustrative numbers. Don't use pluno-involved to define the AI cohort: it's also added when Pluno escalates a ticket. If a human agent later replies publicly on an AI-resolved ticket, Pluno's reporting moves it from AI Resolved to Team Handled, so check those tickets before you compare. Pluno marks a ticket resolved only after a period with no further activity, so AI-resolved tickets get their survey later than tickets an agent solves.
What teams report
- Innovorder reported a 15-percentage-point CSAT increase over one year. Its support lead credited faster first answers as one contributor. In the January 10 to February 10 reporting window, Pluno resolved 67% of its chat and WhatsApp tickets.
- Smartness cut its first response time from hours to 22 minutes.
- Kojo, with a five-person team, reports 30% to 50% ticket deflection.
The Smartness and Kojo results are operational outcomes, separate from Innovorder's customer-reported CSAT change.
Pricing, as listed on the Pluno pricing page on November 9, 2026: a monthly platform fee based on ticket volume, starting at 249€ a month (210€ a month billed annually) for up to 500 tickets. It covers AI Tagging & Field Filling, Escalation Copilot, ticket trends and topic insights, and ticket and call summaries.
Modules priced separately: Deflection AI costs 0.90€ per resolution, meaning a ticket Pluno resolved without a human getting involved. AI Copilot is 49€ per seat a month and Quality Assurance 35€ per agent a month. Pluno offers a 14-day free trial; the Troubleshooting Agent uses credits, and new workspaces receive 4,080 free credits.
The bottom line
CSAT is the percentage of valid survey responses marked satisfied with a support interaction. Calculate it the standard way (satisfied responses ÷ all valid responses × 100), write the definition next to the number and judge it against your own trend on comparable tickets, not a cross-industry benchmark.
Then read it properly. Check whether a change holds up before you act, tag every neutral and negative rating as support, product or policy, and report AI-resolved, human-resolved and handoff cohorts separately.
If better first answers on technical tickets are where your CSAT is stuck, request a free 50-ticket simulation. We compare Pluno's draft replies and handoff decisions with the replies your team actually sent. The simulation runs offline and sends no replies to customers. Score three things in the replay: whether each answer is accurate, whether the ticket would really be resolved, and what context a human would receive on a handoff.
Prefer a walkthrough first? Book a demo instead.
FAQ
What is CSAT, and what does it stand for?
CSAT stands for customer satisfaction score. In customer support, it's the percentage of valid survey responses marked satisfied with a specific interaction, such as a solved ticket or a chat, usually a 4 or 5 on a five-point scale. Teams use it to coach agents, find broken processes and spot contact reasons where customers are unhappy.
How do you calculate a CSAT score?
Divide the number of satisfied responses by the total number of valid responses and multiply by 100. On a five-point scale, ratings of 4 and 5 count as satisfied. For example, 800 ratings of 4 or 5 out of 1,000 valid responses give a CSAT score of 80%.
What is a good CSAT score? Is 80% good?
There's no universal target. Freshdesk reported a median of 80% for Software & IT in its 2021 dataset (vendor research). Use that as historical context, then set a target from comparable queues, channels and survey rules in your own data, and judge the trend.
What is a good CSAT score out of 5?
A mean rating needs the underlying rating counts before you can calculate top-two-box CSAT. Add the 4s and 5s, then divide by all valid ratings. Two teams can average 4.0 out of 5 with very different CSAT percentages, so compare like with like.
What is the difference between CSAT and NPS?
CSAT measures satisfaction with one interaction, right after it happens. NPS (Net Promoter Score) asks how likely a customer is to recommend your company on a 0 to 10 scale, then subtracts the percentage of detractors from the percentage of promoters. Use CSAT for support and NPS as a relationship indicator.
What is the difference between CSAT and CES?
CSAT asks how satisfied the customer was. CES (Customer Effort Score) asks how easy it was to get the issue handled, on an agreement scale defined by the survey. CES is better at exposing transfers, repeat contacts and self-service gaps, while CSAT covers the overall feeling about the interaction.
What is a good CSAT survey question?
"How satisfied were you with the support you received on this request?" on a labeled five-point scale is a practical starting point. Name the interaction rather than the company, and ask "What could we have done better?" after ratings of 1 to 3, or offer an optional comment across the full scale.
When should you send a CSAT survey?
Send it soon after the ticket is solved, while the interaction is fresh. Zendesk, for example, sends email surveys one day after a ticket is solved by default and shows messaging surveys right away. Send one survey per solved ticket, not one per reply.
How can I improve my CSAT score?
Fix the causes behind negative ratings: resolve on the first contact, make first answers complete, update customers while they wait on engineering and follow up on every 1 or 2 within a day. Tag each neutral and negative rating as support, product or policy, so the right team fixes it.
How many responses do you need for a reliable CSAT score?
It depends on how precise you need to be. At 85%, 100 ratings give a 95% Wilson confidence interval of 76.7% to 90.7%, and 1,000 ratings give 82.7% to 87.1%. For month-to-month comparisons on small teams, look at quarters or longer trends, and use the calculator above for your own numbers.
Why did my CSAT score drop?
First check whether the drop holds up: compare the satisfied and total counts for both periods in the calculator. Then segment by contact reason, channel and who resolved the ticket, and read the neutral and negative comments. Many drops trace back to one bug, one policy change or one queue.
How do you measure CSAT for AI-resolved tickets and AI-to-human handoffs?
Report three cohorts separately: AI-resolved, human-resolved and AI-to-human handoffs. For each, track eligible, surveyed and rated conversations, then compare CSAT within the same contact reasons and channels. Separate AI feedback measures, such as Zendesk's BSAT, may only cover AI-only conversations.